Now trading at a price of $26.55, Peapack-Gladstone Financial has moved -0.6% so far today.
Peapack-Gladstone Financial returned losses of -21.0% last year, with its stock price reaching a high of $42.19 and a low of $22.88. Over the same period, the stock underperformed the S&P 500 index by -36.0%. As of April 2023, the company's 50-day average price was $28.11. Peapack-Gladstone Financial Corporation operates as the bank holding company for Peapack-Gladstone Bank that provides private banking and wealth management services in the United States. Based in Bedminster, NJ, the small-cap Finance company has 520 full time employees. Peapack-Gladstone Financial has offered a 0.7% dividend yield over the last 12 months.
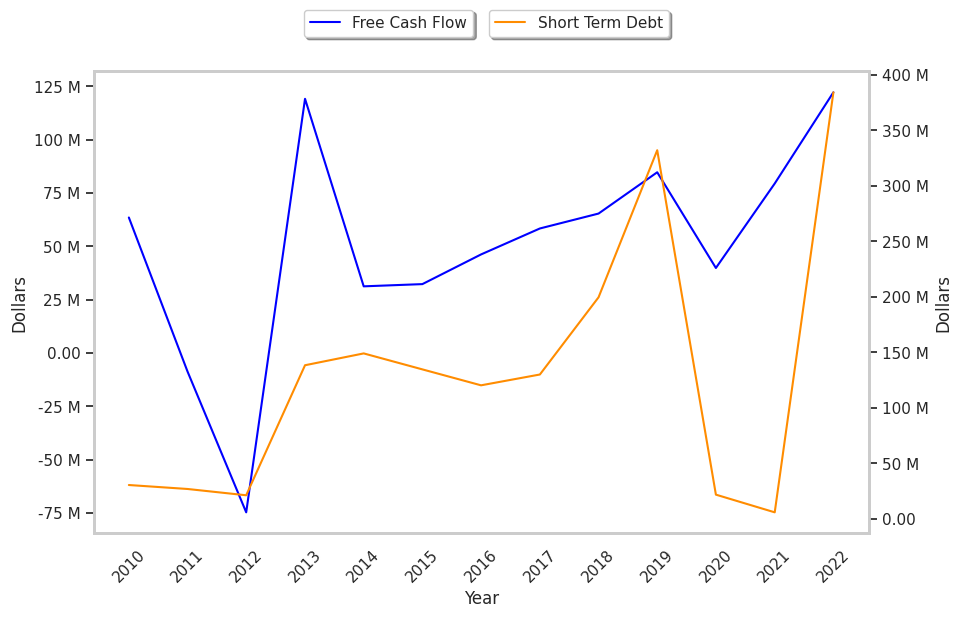
The Business Runs With Low Debt Levels:
| 2018-03-12 | 2019-03-14 | 2020-03-13 | 2021-03-12 | 2022-03-14 | 2023-03-13 | |
|---|---|---|---|---|---|---|
| Revenue (k) | $143,391 | $161,778 | $172,114 | $179,889 | $204,655 | $244,041 |
| Operating Margins | 36% | 37% | 37% | 15% | 35% | 43% |
| Net Margins | 25% | 27% | 28% | 15% | 28% | 30% |
| Net Income (k) | $36,497 | $44,170 | $47,434 | $26,192 | $56,622 | $74,246 |
| Earnings Per Share | $2.03 | $2.31 | $2.44 | $1.37 | $2.97 | $3.85 |
| EPS Growth | n/a | 13.79% | 5.63% | -43.85% | 116.79% | 29.63% |
| Diluted Shares (k) | 17,944 | 19,149 | 19,411 | 19,081 | 19,071 | 19,293 |
| Free Cash Flow (k) | $58,315 | $65,307 | $84,665 | $39,795 | $79,391 | $122,141 |
| Capital Expenditures | -$2,380 | -$1,059 | $1,631 | -$3,075 | -$3,928 | -$3,240 |
| Long Term Debt (k) | n/a | n/a | n/a | $358,880 | $132,701 | $132,987 |
Peapack-Gladstone Financial has weak revenue growth and a flat capital expenditure trend, average net margins with a stable trend, and irregular cash flows. We also note that the company benefits from low debt levels and a strong EPS growth trend. Furthermore, Peapack-Gladstone Financial's financial statements do not display any obvious red flags.
Peapack-Gladstone Financial Has Attractive Multiples and Trades Below Its Graham Number:
Peapack-Gladstone Financial has a trailing twelve month P/E ratio of 7.1, compared to an average of 14.34 for the Finance sector. Based on its EPS guidance of $2.85, the company has a forward P/E ratio of 9.9. The company doesn't provide forward earnings guidance, and the compound average growth rate of its last 6 years of reported EPS is 11.7%. On this basis, Peapack-Gladstone Financial's PEG ratio is 0.61. Using instead the 8.9% weighted average of Peapack-Gladstone Financial's earnings CAGR and the broader market's anticipated 5-year EPS growth rate, the company's PEG ratio is 0.8, which implies that its shares may be underpriced. Additionally, the market is possibly undervaluing Peapack-Gladstone Financial in terms of its equity because its P/B ratio is 0.83 whereas the sector average is 1.57. The company's shares are currently trading -45.7% below their Graham number.
There's an Analyst Consensus of Strong Upside Potential for Peapack-Gladstone Financial:
The 4 analysts following Peapack-Gladstone Financial have set target prices ranging from $33.0 to $36.5 per share, for an average of $34.63 with a buy rating. As of April 2023, the company is trading -18.8% away from its average target price, indicating that there is an analyst consensus of strong upside potential.
Peapack-Gladstone Financial has a very low short interest because 1.3% of the company's shares are sold short. Institutions own 73.2% of the company's shares, and the insider ownership rate stands at 10.55%, suggesting a decent amount of insider shareholders. The largest shareholder is Blackrock Inc., whose 8% stake in the company is worth $37,913,611.


