Today shares of Carnival have fallen -5.6%, to a price of $13.63. Since it has an average rating of buy, many investors will be using today as an opportunity to buy the dip. But what if the stock is overvalued? Don't blindly trust analyst ratings before looking at the fundamentals yourself!
The first step in determining whether a stock is overvalued is to check its price to book (P/B) ratio. This is perhaps the most basic measure of a company's valuation, which is its market value divided by its book value. Book value refers to the sum of all of the company's assets minus its liabilities -- you can also think of it as the company's equity value.
Traditionally, value investors would look for companies with a ratio of less than 1 (meaning that the market value was smaller than the company's book value), but such opportunities are very rare these days. So we tend to look for company's whose valuations are less than their sector and market average. The P/B ratio for Carnival is 2.94, compared to its sector average of 3.12 and the S&P 500's average P/B of 2.95.
Modernly, the most common metric for valuing a company is its Price to Earnings (P/E) ratio. It's simply today's stock price of 13.63 divided by either its trailing or forward earnings, which for Carnival are $-2.73 and $0.91 respectively. Based on these values, the company's trailing P/E ratio is -5.0 and its forward P/E ratio is 15.0. By way of comparison, the average P/E ratio of the Consumer Discretionary sector is 22.33 and the average P/E ratio of the S&P 500 is 15.97.
The problem with P/E ratios is that they don't take into account the growth of earnings. This means that a company with a higher than average P/E ratio may still be undervalued if it has extremely high projected earnings growth. Conversely, a company with a low P/E ratio may not present a good value proposition if its projected earnings are stagnant.
When we divide Carnival's P/E ratio by its projected 5 year earnings growth rate, we obtain its Price to Earnings Growth (PEG) ratio of 0.6. Since a PEG ratio between 0 and 1 may indicate that the company's valuation is proportionate to its growth potential, we see here that CCL is actually fairly valued if we factor growth into the price to earnings calculus. One important caveat here is that PEG ratios are calculated on the basis of future earnings growth estimates, which may turn out to be wrong.
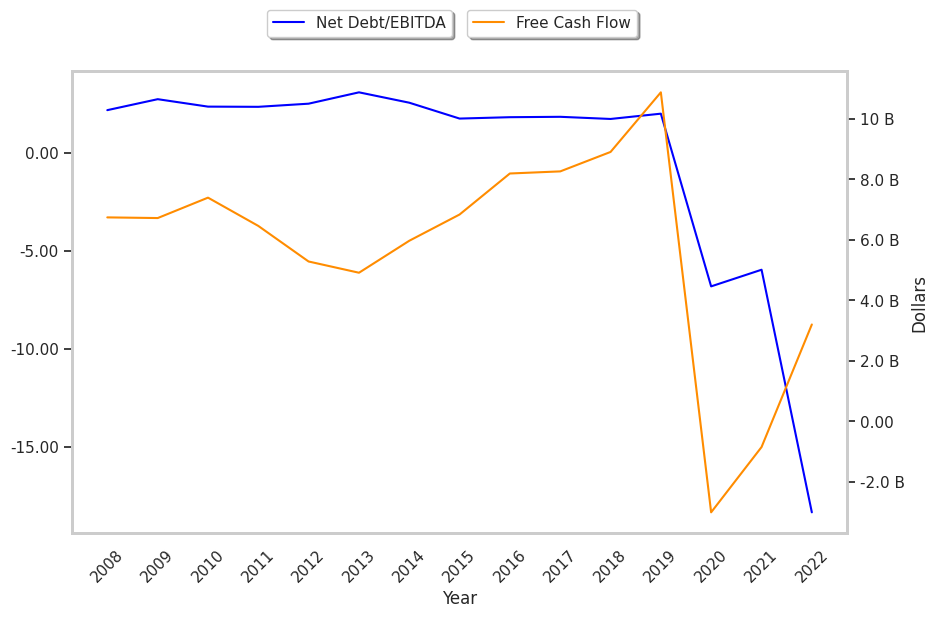
Indebted or mismanaged companies can't sustain shareholder value for long, even if they have strong earnings. For this reason, considering Carnival's ability to meet its debt obligations is also an important aspect of pinning down its valuation. By adding up its current assets, then subtracting its inventory and prepaid expenses, and then dividing the whole by its current liabilities, we obtain the company's Quick Ratio of 0.443. Since CCL's is lower than 1, it does not have the liquidity necessary to meet its current liabilities.
When we had up all the inflows and outflows of cash, including payments to creditors, we obtain Carnival's levered free cash flow of $3.2 Billion. This represents the money left over from the company's operations that is available for reinvestment in the business, or for paying out to equity investors in the form of a dividend. Despite its positive cash flows, Carnival does not currently pay a dividend.
Despite the quantitative evidence that Carnival is overvalued, analysts are mostly bullish on the stock. What do they know about the stock's that trumps its weak valuation and growth potential? We will look into this question in a future report focusing on qualitative factors that might be favoring CCL.


