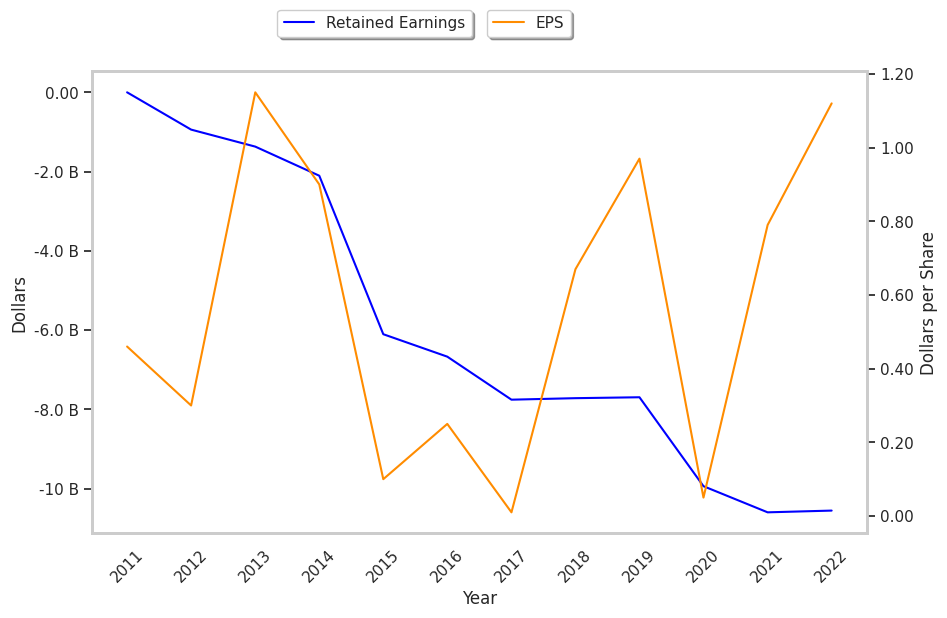
We've been asking ourselves recently if the market has placed a fair valuation on Kinder Morgan. Let's dive into some of the fundamental values of this large-cap Utilities company to determine if there might be an opportunity here for value-minded investors.
Kinder Morgan Is Reasonably Priced:
Kinder Morgan, Inc. operates as an energy infrastructure company in North America. The company belongs to the Utilities sector, which has an average price to earnings (P/E) ratio of 22.89 and an average price to book (P/B) ratio of 1.03. In contrast, Kinder Morgan has a trailing 12 month P/E ratio of 14.9 and a P/B ratio of 1.21.
Kinder Morgan's PEG ratio is 49.6, which shows that the stock is probably overvalued in terms of its estimated growth. For reference, a PEG ratio near or below 1 is a potential signal that a company is undervalued.
Exceptional Profitability Overshadowed by Excessive Leverage:
| 2018-02-09 | 2019-02-08 | 2020-02-12 | 2021-02-05 | 2022-02-07 | 2023-02-08 | |
|---|---|---|---|---|---|---|
| Revenue (MM) | $13,705 | $14,144 | $13,209 | $11,700 | $16,610 | $19,200 |
| Gross Margins | 68.0% | 69.0% | 75.0% | 78.0% | 61.0% | 52.0% |
| Operating Margins | 26% | 28% | 30% | 30% | 27% | 21% |
| Net Margins | 1.0% | 11.0% | 17.0% | 1.0% | 11.0% | 13.0% |
| Net Income (MM) | $183 | $1,609 | $2,190 | $119 | $1,784 | $2,548 |
| Net Interest Expense (MM) | -$1,832 | -$1,917 | -$1,801 | -$1,595 | -$1,492 | -$1,513 |
| Depreciation & Amort. (MM) | -$2,261 | -$2,297 | -$2,411 | -$2,164 | -$2,135 | -$2,186 |
| Earnings Per Share | $0.01 | $0.67 | $0.97 | $0.05 | $0.79 | $1.12 |
| EPS Growth | n/a | 6600.0% | 44.78% | -94.85% | 1480.0% | 41.77% |
| Diluted Shares (MM) | 2,230 | 2,216 | 2,264 | 2,263 | 2,267 | 2,265 |
| Free Cash Flow (MM) | $7,671 | $7,843 | $6,936 | $5,188 | $6,583 | $6,582 |
| Capital Expenditures (MM) | -$3,070 | -$2,800 | -$2,188 | -$638 | -$875 | -$1,615 |
| Net Current Assets (MM) | -$41,216 | -$37,947 | -$36,030 | -$36,204 | -$34,666 | -$34,161 |
| Long Term Debt (MM) | $33,988 | $33,105 | $30,883 | $30,838 | $29,772 | $28,288 |
| Net Debt / EBITDA | 6.3 | 5.31 | 5.09 | 5.7 | 4.69 | 4.97 |
Kinder Morgan has strong margins with a stable trend, exceptional EPS growth, and wider gross margins than its peer group. However, the firm has a highly leveraged balance sheet. Finally, we note that Kinder Morgan has weak revenue growth and a flat capital expenditure trend and irregular cash flows.


