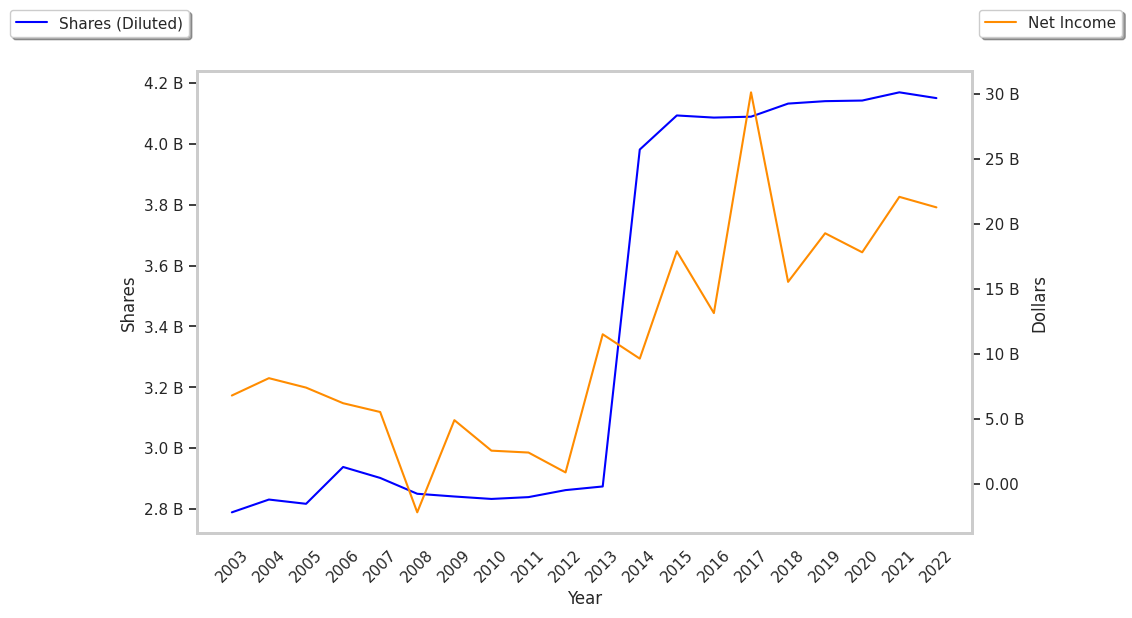
Now trading at a price of $41.48, Verizon Communications has moved -1.8% so far today.
Over the last year, Verizon Communications logged a 4.7% change, with its stock price reaching a high of $42.34 and a low of $30.14. Over the same period, the stock underperformed the S&P 500 index by -16.4%. As of April 2023, the company's 50-day average price was $37.93. Verizon Communications Inc., through its subsidiaries, provides communications, technology, information, and entertainment products and services to consumers, businesses, and governmental entities worldwide. Based in New York, NY, the large-cap Telecommunications company has 105,400 full time employees. Verizon Communications has offered a 6.2% dividend yield over the last 12 months.
The Company Has Stagnant Revenues:
| 2018 | 2019 | 2020 | 2021 | 2022 | 2023 | |
|---|---|---|---|---|---|---|
| Revenue (MM) | $130,863 | $131,868 | $128,292 | $133,613 | $136,835 | $134,095 |
| Revenue Growth | n/a | 0.77% | -2.71% | 4.15% | 2.41% | -2.0% |
| Operating Margins | 17% | 23% | 22% | 24% | 22% | 22% |
| Net Margins | 12% | 15% | 14% | 17% | 16% | 16% |
| Net Income (MM) | $15,528 | $19,265 | $17,801 | $22,065 | $21,256 | $20,896 |
| Net Interest Expense (MM) | $4,833 | $4,730 | $4,247 | $3,485 | $3,613 | $5,030 |
| Depreciation & Amort. (MM) | $17,403 | $16,682 | $16,720 | $16,206 | $17,099 | $17,326 |
| Earnings Per Share | $3.76 | $4.65 | $4.3 | $5.32 | $5.06 | $4.96 |
| EPS Growth | n/a | 23.67% | -7.53% | 23.72% | -4.89% | -1.98% |
| Diluted Shares (MM) | 4,132 | 4,140 | 4,142 | 4,150 | 4,204 | 4,216 |
| Free Cash Flow (MM) | $17,681 | $17,807 | $23,576 | $19,253 | $14,054 | $16,300 |
| Capital Expenditures (MM) | $16,658 | $17,939 | $18,192 | $20,286 | $23,087 | $21,440 |
| Current Ratio | 0.91 | 0.84 | 1.38 | 0.78 | 0.75 | 0.68 |
| Total Debt (MM) | $113,063 | $111,489 | $123,173 | $143,425 | $140,676 | $134,441 |
| Net Debt / EBITDA | 2.78 | 2.31 | 2.22 | 2.89 | 2.9 | 2.78 |
Verizon Communications's Earnings and Assets May Be Undervalued:
Verizon Communications has a trailing twelve month P/E ratio of 13.8, compared to an average of 23.78 for the Telecommunications sector. Based on its EPS guidance of $4.73, the company has a forward P/E ratio of 8.0. The 3.3% compound average growth rate of Verizon Communications's historical and projected earnings per share yields a PEG ratio of 4.14. This suggests that these shares are overvalued. In contrast, the market is likely undervaluing Verizon Communications in terms of its equity because its P/B ratio is 1.89 while the sector average is 3.46.
Analysts Give Verizon Communications an Average Rating of Buy:
The 24 analysts following Verizon Communications have set target prices ranging from $31.0 to $49.0 per share, for an average of $42.38 with a buy rating. As of April 2023, the company is trading -10.5% away from its average target price, indicating that there is an analyst consensus of some upside potential.
Verizon Communications has a very low short interest because 0.9% of the company's shares are sold short. Institutions own 62.5% of the company's shares, and the insider ownership rate stands at 0.03%, suggesting a small amount of insider investors. The largest shareholder is Vanguard Group Inc, whose 8% stake in the company is worth $14,584,069,898.


