Biotechnology company CRISPR Therapeutics is standing out today, surging to $66.34 and marking a 6.5% change. In comparison the S&P 500 moved only 1.0%. CRSP is -21.3% below its average analyst target price of $84.29, which implies there is more upside for the stock.
As such, the average analyst rates it at buy. Over the last year, CRISPR Therapeutics has underperfomed the S&P 500 by 17.3%, moving 5.7%.
CRISPR Therapeutics AG, a gene editing company, focuses on developing gene-based medicines for serious human diseases using its Clustered Regularly Interspaced Short Palindromic Repeats (CRISPR)/CRISPR-associated protein 9 (Cas9) platform. The company is part of the healthcare sector. Healthcare companies work in incredibly complex markets, and their valuations can change in an instant based on a denied drug approval, a research and development breakthrough at a competitor, or a new government regulation. In the longer term, healthcare companies are affected by factors as varied as demographics and epidemiology. Investors who want to understand the healthcare market should be prepared for deep dives into a wide range of topics.
CRISPR Therapeutics does not publish either its forward or trailing P/E ratios because their values are negative -- meaning that each share of stock represents a net earnings loss. But we can calculate these P/E ratios anyways using the stocks forward and trailing (EPS) values of $-4.55 and $-2.7. We can see that CRSP has a forward P/E ratio of -14.6 and a trailing P/E ratio of -24.6.
The P/E ratio is the company's share price divided by its earnings per share. In other words, it represents how much investors are willing to spend for each dollar of the company's earnings (revenues minus the cost of goods sold, taxes, and overhead). As of the second quarter of 2024, the health care sector has an average P/E ratio of 27.53, and the average for the S&P 500 is 27.65.
The main limitation with P/E ratios is that they don't take into account the growth of earnings. This means that a company with a higher than average P/E ratio may still be undervalued if it has high projected earnings growth. Conversely, a company with a low P/E ratio may not present a good value proposition if its projected earnings are stagnant.
When we divide CRISPR Therapeutics's P/E ratio by its projected 5 year earnings growth rate, we obtain its Price to Earnings Growth (PEG) ratio of 0.05. Since a PEG ratio of 1 or less may indicate that the company's valuation is proportionate to its growth potential, we see here that investors are undervaluing CRSP's growth potential .
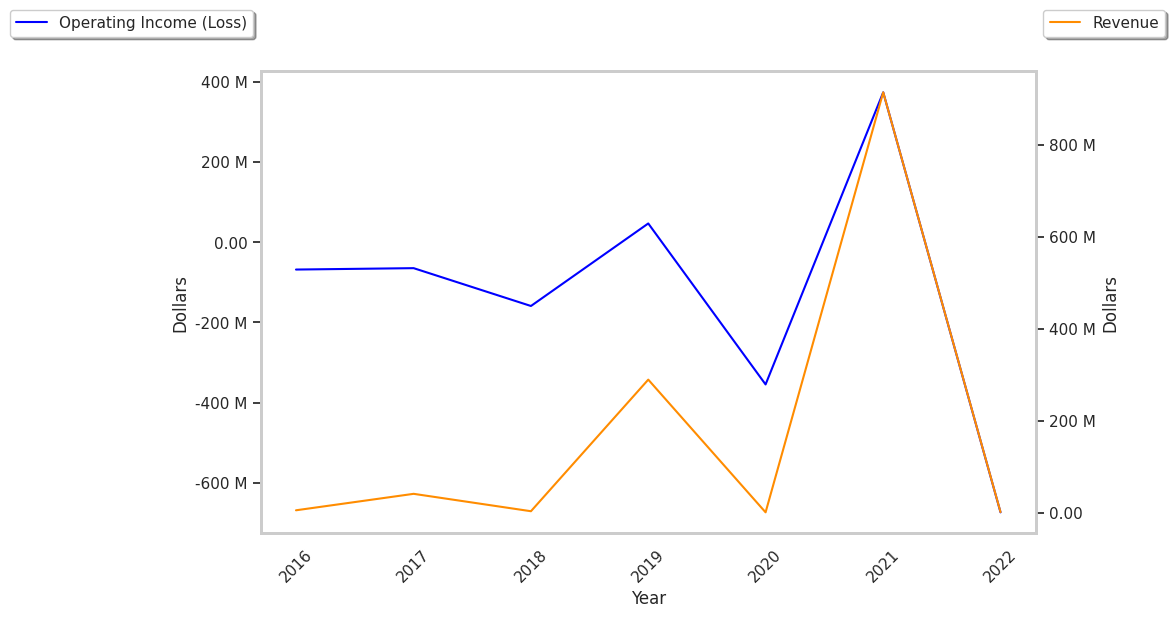
Another key to assessing a company's health is to look at its free cash flow, which is calculated on the basis of its total cash flow from operating activities minus its capital expenditures. Capital expenditures are the costs of maintaining fixed assets such as land, buildings, and equipment. From CRISPR Therapeutics's last four annual reports, we are able to obtain the following rundown of its free cash flow:
| Date Reported | Cash Flow from Operations ($ k) | Capital expenditures ($ k) | Free Cash Flow ($ k) | YoY Growth (%) |
|---|---|---|---|---|
| 2023 | -260,375 | 9,470 | -269,845 | 49.37 |
| 2022 | -495,741 | 37,188 | -532,929 | -216.55 |
| 2021 | 538,972 | 81,705 | 457,267 | 278.12 |
| 2020 | -238,366 | 18,358 | -256,724 | -613.52 |
| 2019 | 56,677 | 6,684 | 49,993 | 150.49 |
| 2018 | -96,239 | 2,773 | -99,012 |
- Average free cash flow: $-108541666.7
- Average free cash flown growth rate: -61.6 %
- Coefficient of variability (the lower the better): 0.0 %
If it weren't negative, the free cash flow would represent the amount of money available for reinvestment in the business, or for payments to equity investors in the form of a dividend. While a negative cash flow for one or two quarters is not a sign of financial troubles for CRSP, a long term trend of negative or highly erratic cash flow levels may indicate a struggling business or a mismanaged company.
Value investors often analyze stocks through the lens of its Price to Book (P/B) Ratio (market value divided by book value). The book value refers to the present value of the company if the company were to sell off all of its assets and pay all of its debts today - a number whose value may differ significantly depending on the accounting method.
CRISPR Therapeutics has a P/B ratio of 2.7. This indicates that the market value of the company exceeds its book value by a factor of more than 2, but is still below the average P/B ratio of the Health Care sector, which stood at 3.61 as of the second quarter of 2024.
CRISPR Therapeutics is by most measures overvalued because it has a negative P/E ratio., a lower P/B ratio than its sector average, and negative cash flows with a downwards trend. The stock has mixed growth prospects because it has a a negative PEG ratio and weak operating margins with a positive growth rate. We hope you enjoyed this overview of CRSP's fundamentals.