It's been a great evening session for Centene investors, who saw their shares rise 1.9% to a price of $68.98 per share. At these higher prices, is the company still fairly valued? If you are thinking about investing, make sure to check the company's fundamentals before making a decision.
Centene Has Attractive Multiples and Potentially Undervalued:
Centene Corporation operates as a healthcare enterprise that provides programs and services to under-insured and uninsured families, commercial organizations, and military families in the United States. The company belongs to the Health Care sector, which has an average price to earnings (P/E) ratio of 27.53 and an average price to book (P/B) ratio of 3.61. In contrast, Centene has a trailing 12 month P/E ratio of 13.6 and a P/B ratio of 1.37.
When we divideCentene's P/E ratio by its expected five-year EPS growth rate, we obtain a PEG ratio of 0.79, which indicates that the market is undervaluing the company's projected growth (a PEG ratio of 1 indicates a fairly valued company). Your analysis of the stock shouldn't end here. Rather, a good PEG ratio should alert you that it may be worthwhile to take a closer look at the stock.
Strong Revenue Growth but an Average Current Ratio:
| 2018 | 2019 | 2020 | 2021 | 2022 | 2023 | |
|---|---|---|---|---|---|---|
| Revenue (M) | $60,116 | $74,639 | $111,115 | $125,982 | $144,547 | $153,999 |
| Net Margins | 1% | 2% | 2% | 1% | 1% | 2% |
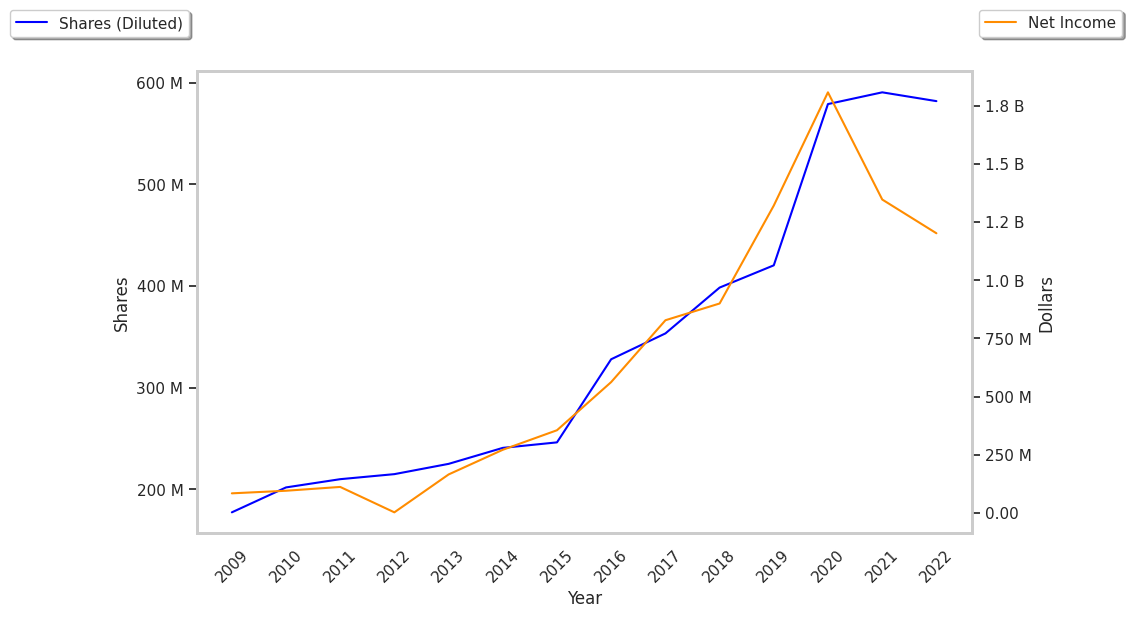
| Net Income (M) | $900 | $1,321 | $1,808 | $1,347 | $1,202 | $2,702 |
| Net Interest Expense (M) | $343 | $412 | $728 | $665 | $665 | $725 |
| Depreciation & Amort. (M) | $495 | $643 | $1,259 | $1,335 | $614 | $575 |
| Diluted Shares (M) | 399 | 420 | 579 | 591 | 582 | 546 |
| Earnings Per Share | $2.26 | $3.14 | $3.12 | $2.28 | $2.07 | $4.95 |
| EPS Growth | n/a | 38.94% | -0.64% | -26.92% | -9.21% | 139.13% |
| Avg. Price | $61.6 | $54.34 | $62.87 | $67.69 | $82.67 | $68.98 |
| P/E Ratio | 47.38 | 33.96 | 20.41 | 29.18 | 40.13 | 14.08 |
| Free Cash Flow (M) | $559 | $753 | $4,634 | $3,295 | $5,257 | $7,254 |
| CAPEX (M) | $675 | $730 | $869 | $910 | $1,004 | $799 |
| EV / EBITDA | 22.68 | 19.28 | 9.92 | 14.6 | 28.14 | 11.1 |
| Total Debt (M) | $6,889 | $13,947 | $16,977 | $19,293 | $18,261 | $18,081 |
| Net Debt / EBITDA | 0.79 | 0.75 | 1.42 | 1.98 | 3.2 | 0.25 |
| Current Ratio | 1.0 | 1.57 | 1.08 | 1.11 | 1.06 | 1.11 |
Centene has rapidly growing revenues and a flat capital expenditure trend and generally positive cash flows. Additionally, the company's financial statements display a strong EPS growth trend and healthy leverage levels. Furthermore, Centene has just enough current assets to cover current liabilities, as shown by its current ratio of 1.11.