Cummins may be undervalued with poor growth indicators, but the 15 analysts following the company give it an rating of hold. Their target prices range from $259.0 to $345.0 per share, for an average of $303.59. At today's price of $278.31, Cummins is trading -8.33% away from its average target price, suggesting there is an analyst consensus of some upside potential for the stock.
Cummins Inc. designs, manufactures, distributes, and services diesel and natural gas engines, electric and hybrid powertrains, and related components worldwide. Based in Columbus, IN, the Large-Cap Industrials company has 75,500 full time employees. Cummins has provided a 2.4% dividend yield over the last 12 months.
Cummins has a trailing twelve month P/E ratio of 20.4, compared to an average of 25.4 for the Industrials sector. Considering its EPS guidance of $21.69, the company has a forward P/E ratio of 12.8.
Cummins is also overpriced compared to its book value, since its P/B ratio of 4.2 is higher than the sector average of 3.23. The company's shares are currently 228.3% below their Graham number, indicating that its shares have a margin of safety.
The question is, why does Cummins have a bad rating if it is apparently undervalued in terms of traditional metrics? One reason could be the company's disappointing rate of margin growth, which in the analysts' opinion, will continue in coming years.
| 2018 | 2019 | 2020 | 2021 | 2022 | 2023 | |
|---|---|---|---|---|---|---|
| Revenue (M) | $23,771 | $23,571 | $19,811 | $24,021 | $28,074 | $34,065 |
| Gross Margins | 24% | 25% | 25% | 24% | 24% | 24% |
| Net Margins | 9% | 10% | 9% | 9% | 8% | 2% |
| Net Income (M) | $2,187 | $2,268 | $1,811 | $2,164 | $2,183 | $840 |
| Net Interest Expense (M) | $114 | $109 | $100 | $111 | $199 | $375 |
| Depreciation & Amort. (M) | $611 | $672 | $673 | $662 | $784 | $1,024 |
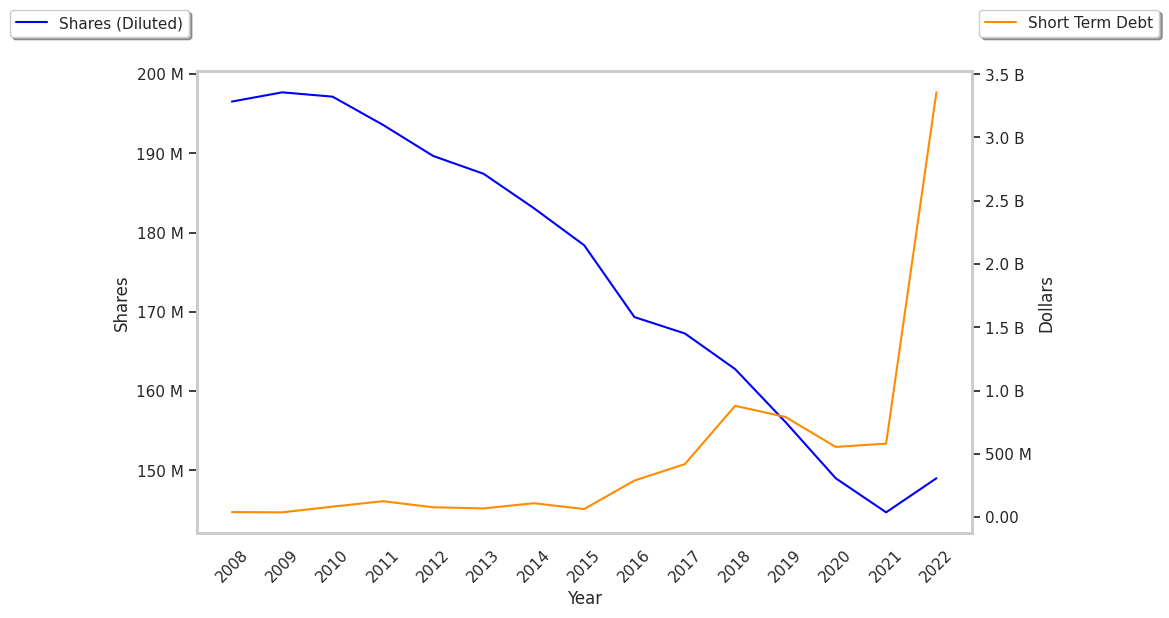
| Diluted Shares (M) | 163 | 156 | 149 | 146 | 142 | 143 |
| Earnings Per Share | $13.15 | $14.48 | $12.01 | $14.61 | $15.12 | $5.15 |
| EPS Growth | n/a | 10.11% | -17.06% | 21.65% | 3.49% | -65.94% |
| Avg. Price | $131.18 | $146.05 | $171.67 | $229.34 | $200.76 | $278.42 |
| P/E Ratio | 9.94 | 10.04 | 14.22 | 15.56 | 13.21 | 53.65 |
| Free Cash Flow (M) | $1,669 | $2,481 | $2,194 | $1,522 | $1,046 | $2,753 |
| CAPEX (M) | $709 | $700 | $528 | $734 | $916 | $1,213 |
| EV / EBITDA | 6.5 | 6.96 | 8.86 | 10.01 | 8.52 | 15.12 |
| Total Debt (M) | $1,642 | $1,607 | $3,672 | $3,638 | $5,071 | $4,920 |
| Net Debt / EBITDA | 0.1 | 0.14 | 0.09 | 0.31 | 0.82 | 0.98 |
| Current Ratio | 1.54 | 1.5 | 1.88 | 1.74 | 1.27 | 1.18 |