Microchip Technology shares fell by -5.2% during the day's afternoon session, and are now trading at a price of $88.62. Is it time to buy the dip? To better answer that question, it's essential to check if the market is valuing the company's shares fairly in terms of its earnings and equity levels.
a Very Low P/E Ratio but Priced Beyond Its Margin of Safety:
Microchip Technology Incorporated engages in the development, manufacture, and sale of smart, connected, and secure embedded control solutions in the Americas, Europe, and Asia. The company belongs to the Technology sector, which has an average price to earnings (P/E) ratio of 32.54 and an average price to book (P/B) ratio of 4.25. In contrast, Microchip Technology has a trailing 12 month P/E ratio of 25.5 and a P/B ratio of 7.14.
When we divide Microchip Technology's P/E ratio by its expected EPS growth rate of the next five years, we obtain its PEG ratio of -5.66. Since it's negative, the company has negative growth expectations, and most investors will probably avoid the stock unless it has an exceptionally low P/E and P/B ratio.
Wider Gross Margins Than the Industry Average of 45.29%:
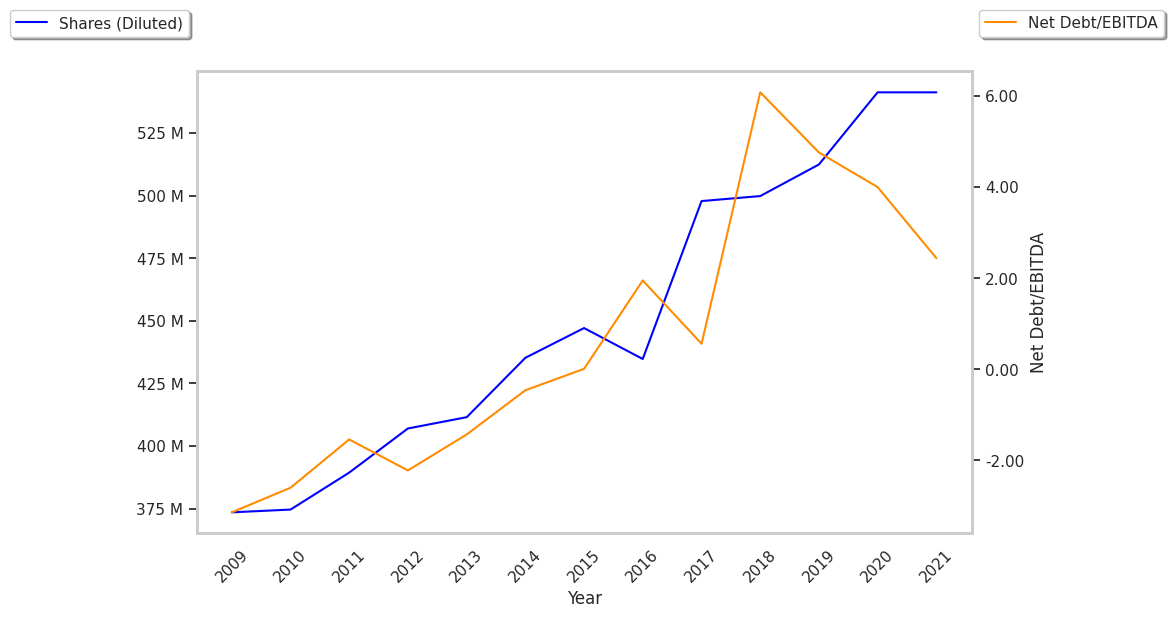
| 2018 | 2019 | 2020 | 2021 | 2022 | 2023 | |
|---|---|---|---|---|---|---|
| Revenue (M) | $5,350 | $5,274 | $5,438 | $6,821 | $8,439 | $7,634 |
| Gross Margins | 55% | 61% | 62% | 65% | 68% | 65% |
| Net Margins | 7% | 11% | 6% | 19% | 27% | 25% |
| Net Income (M) | $356 | $571 | $349 | $1,286 | $2,238 | $1,907 |
| Net Interest Expense (M) | $503 | $497 | $357 | $257 | $204 | $198 |
| Depreciation & Amort. (M) | $876 | $1,216 | $1,153 | $1,144 | $998 | $880 |
| Diluted Shares (M) | 517 | 551 | 567 | 555 | 546 | 548 |
| Earnings Per Share | $0.69 | $1.04 | $0.62 | $2.31 | $4.09 | $3.48 |
| EPS Growth | n/a | 50.72% | -40.38% | 272.58% | 77.06% | -14.91% |
| Avg. Price | $39.79 | $42.37 | $49.48 | $74.34 | $68.7 | $88.99 |
| P/E Ratio | 53.05 | 36.53 | 77.31 | 32.04 | 16.76 | 25.07 |
| Free Cash Flow (M) | $1,656 | $1,476 | $1,824 | $2,473 | $3,135 | $2,608 |
| CAPEX (M) | $19 | $68 | $93 | $370 | $486 | $285 |
| EV / EBITDA | 18.53 | 16.2 | 16.71 | 15.88 | 10.76 | 15.78 |
| Total Debt (M) | $10,941 | $9,750 | $9,191 | $6,589 | $7,094 | $6,999 |
| Net Debt / EBITDA | 6.63 | 5.04 | 4.13 | 2.1 | 1.66 | 1.94 |
| Current Ratio | 0.9 | 0.85 | 1.81 | 1.76 | 0.98 | 1.2 |
Microchip Technology benefits from growing revenues and increasing reinvestment in the business, exceptional EPS growth, and generally positive cash flows. The company's financial statements show wider gross margins than its peer group and healthy leverage levels. Furthermore, Microchip Technology has just enough current assets to cover current liabilities, as shown by its current ratio of 1.2.