It hasn't been a great evening session for BioMarin Pharmaceutical investors, who have watched their shares sink by -1.1% to a price of $83.78. Some of you might be wondering if it's time to buy the dip. If you are considering this, make sure to check the company's fundamentals first to determine if the shares are fairly valued at today's prices.
BioMarin Pharmaceutical's Valuation Is in Line With Its Sector Averages:
BioMarin Pharmaceutical Inc. develops and commercializes therapies for people with serious and life-threatening rare diseases and medical conditions. The company belongs to the Health Care sector, which has an average price to earnings (P/E) ratio of 27.53 and an average price to book (P/B) ratio of 3.61. In contrast, BioMarin Pharmaceutical has a trailing 12 month P/E ratio of 79.0 and a P/B ratio of 3.13.
P/E rations can be placed into context by dividing them by the firm's expected 5-year EPS growth rate, which gives us its Price to Earnings Growth (PEG) ratio. BioMarin Pharmaceutical's PEG ratio is 1.05, which tells us the company is fairly valued in terms of growth. PEG ratios under 1 are considered an indicator of undervalued growth, but we need to keep in mind that many successful companies with excellent share performance have maintained much higher PEG ratios.
As always, a quantitative approach to a stock should be supplemented with a look at qualitative factors, such as the competence of its management team, quality of its corporate culture, and the wide variety of social and economic factors that can impact the success of its product.
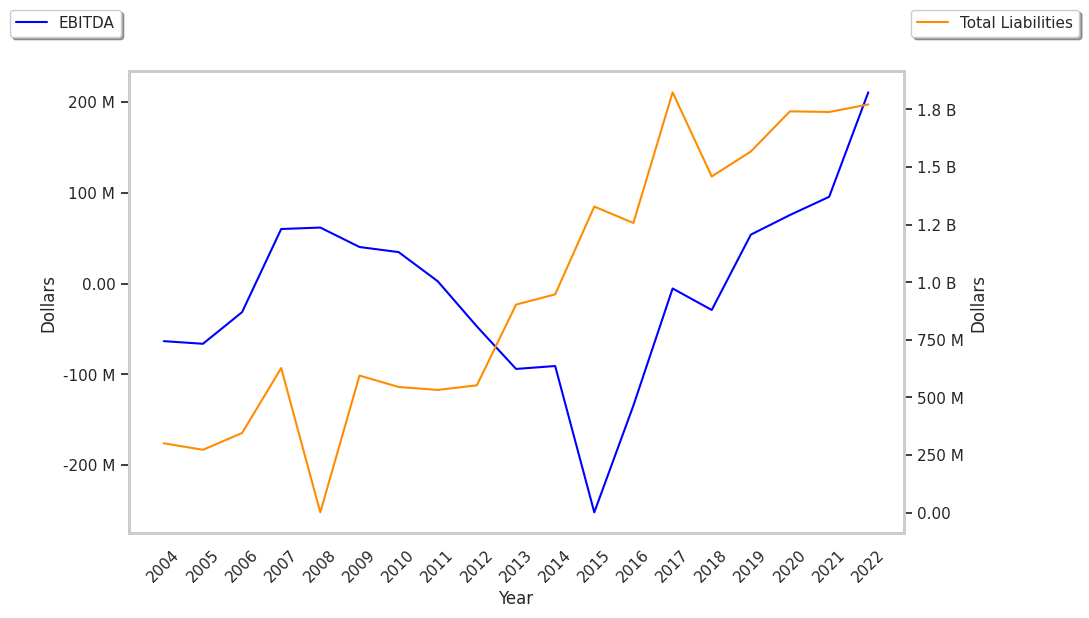
Good EPS Growth at the Expense of a Highly Leveraged Balance Sheet:
| 2018 | 2019 | 2020 | 2021 | 2022 | 2023 | |
|---|---|---|---|---|---|---|
| Revenue (M) | $1,491 | $1,704 | $1,860 | $1,846 | $2,096 | $2,419 |
| Operating Margins | -8% | -6% | -2% | -4% | 7% | 7% |
| Net Margins | -5% | -1% | 46% | -3% | 7% | 7% |
| Net Income (M) | -$77 | -$24 | $854 | -$64 | $142 | $168 |
| Net Interest Expense (M) | $44 | $23 | $29 | $15 | $16 | $17 |
| Depreciation & Amort. (M) | $96 | $105 | $105 | $108 | $102 | $104 |
| Diluted Shares (M) | 177 | 179 | 192 | 183 | 189 | 192 |
| Earnings Per Share | -$0.44 | -$0.13 | $4.5 | -$0.35 | $0.75 | $0.87 |
| EPS Growth | n/a | 70.45% | 3561.54% | -107.78% | 314.29% | 16.0% |
| Avg. Price | $92.12 | $82.57 | $91.51 | $80.59 | $81.85 | $83.78 |
| P/E Ratio | -209.36 | -635.15 | 19.39 | -230.26 | 107.7 | 94.13 |
| Free Cash Flow (M) | -$124 | -$97 | -$29 | $209 | $55 | $63 |
| CAPEX (M) | $145 | $145 | $114 | $96 | $121 | $97 |
| EV / EBITDA | -594.41 | 3125.93 | 273.62 | 589.36 | 61.31 | 60.8 |
| Total Debt (M) | $830 | $848 | $1,075 | $1,079 | $1,083 | $1,087 |
| Net Debt / EBITDA | -12.08 | 84.8 | 6.9 | 19.14 | 1.43 | 1.26 |
| Current Ratio | 3.93 | 2.08 | 4.76 | 4.16 | 4.67 | 2.51 |
BioMarin Pharmaceutical has an excellent current ratio of 2.51, a strong EPS growth trend, and positive cash flows. However, the firm has a highly leveraged balance sheet. Finally, we note that BioMarin Pharmaceutical has growing revenues and decreasing reinvestment in the business and weak operating margins with a positive growth rate.