It hasn't been a great afternoon session for Arista Networks investors, who have watched their shares sink by -1.1% to a price of $367.1. Some of you might be wondering if it's time to buy the dip. If you are considering this, make sure to check the company's fundamentals first to determine if the shares are fairly valued at today's prices.
Arista Networks's Valuation Is in Line With Its Sector Averages:
Arista Networks, Inc. engages in the development, marketing, and sale of data-driven, client to cloud networking solutions for data center, campus, and routing environments in the Americas, Europe, the Middle East, Africa, and the Asia-Pacific. The company belongs to the Telecommunications sector, which has an average price to earnings (P/E) ratio of 22.69 and an average price to book (P/B) ratio of 1.97. In contrast, Arista Networks has a trailing 12 month P/E ratio of 51.0 and a P/B ratio of 14.64.
Arista Networks's PEG ratio is 2.41, which shows that the stock is probably overvalued in terms of its estimated growth. For reference, a PEG ratio near or below 1 is a potential signal that a company is undervalued.
Wider Gross Margins Than the Industry Average of 38.92%:
| 2018 | 2019 | 2020 | 2021 | 2022 | 2023 | |
|---|---|---|---|---|---|---|
| Revenue (M) | $2,151 | $2,411 | $2,318 | $2,948 | $4,381 | $5,860 |
| Gross Margins | 64% | 64% | 64% | 64% | 61% | 62% |
| Net Margins | 15% | 36% | 27% | 28% | 31% | 36% |
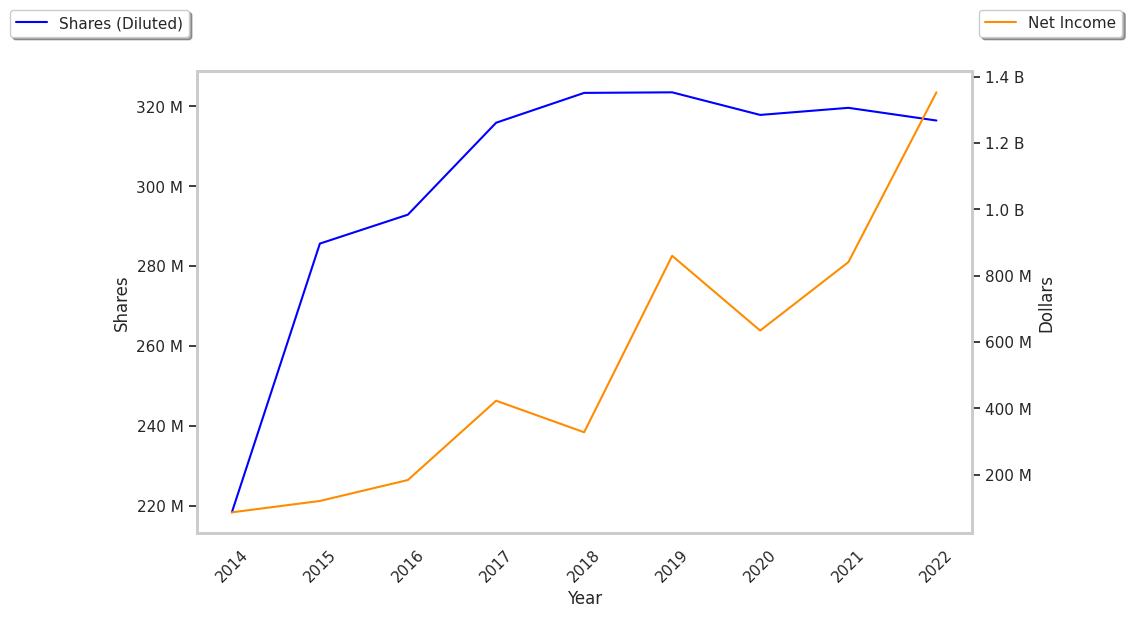
| Net Income (M) | $328 | $860 | $635 | $841 | $1,352 | $2,087 |
| Net Interest Expense (M) | $3 | $51 | $27 | $7 | $28 | $152 |
| Depreciation & Amort. (M) | $28 | $33 | $35 | $50 | $63 | $71 |
| Diluted Shares (M) | 323 | 324 | 318 | 319 | 316 | 317 |
| Earnings Per Share | $1.01 | $2.66 | $2.0 | $2.63 | $4.27 | $6.58 |
| EPS Growth | n/a | 163.37% | -24.81% | 31.5% | 62.36% | 54.1% |
| Avg. Price | $64.55 | $61.76 | $56.13 | $92.57 | $117.3 | $367.13 |
| P/E Ratio | 58.15 | 21.75 | 27.12 | 33.66 | 26.72 | 53.91 |
| Free Cash Flow (M) | $479 | $947 | $720 | $951 | $448 | $2,000 |
| CAPEX (M) | $24 | $16 | $15 | $65 | $45 | $34 |
| Current Ratio | 4.48 | 5.81 | 4.99 | 4.34 | 4.29 | 4.39 |
Arista Networks benefits from rapidly growing revenues and increasing reinvestment in the business, exceptional EPS growth, and generally positive cash flows. The company's financial statements show an excellent current ratio of 4.39 and wider gross margins than its peer group.