Rio Tinto logged a -2.1% change during today's afternoon session, and is now trading at a price of $66.12 per share.
Over the last year, Rio Tinto logged a 0.6% change, with its stock price reaching a high of $75.09 and a low of $58.27. Over the same period, the stock underperformed the S&P 500 index by -23.0%. AThe company's 50-day average price was $68.67. Rio Tinto Group engages in exploring, mining, and processing mineral resources worldwide. Based in London, United Kingdom, the Large-Cap Basic Materials company has 57,000 full time employees. Rio Tinto has offered a 6.4% dividend yield over the last 12 months.
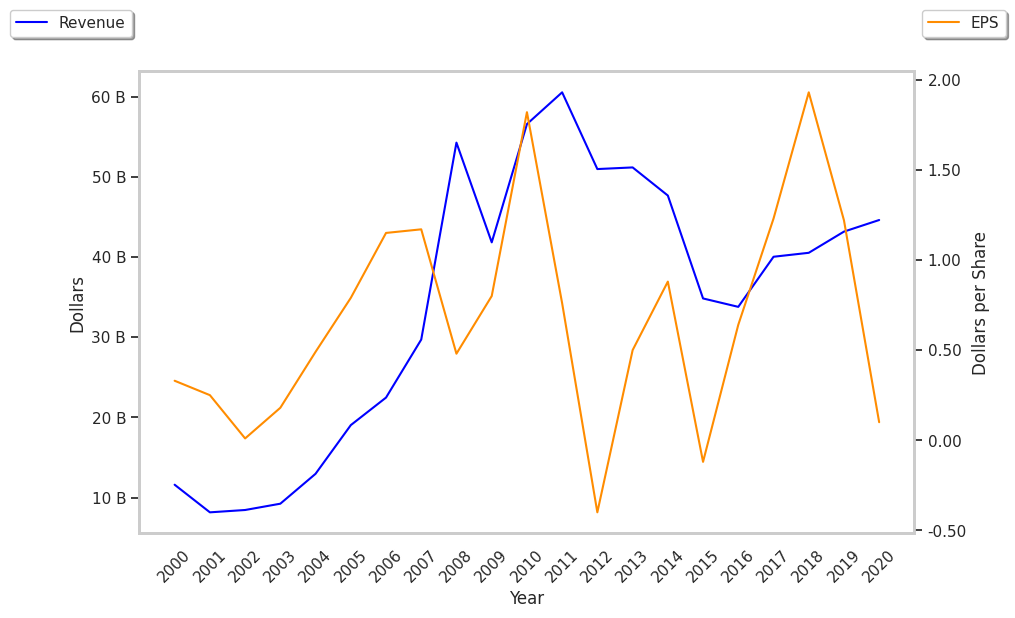
An Excellent Current Ratio but a Declining EPS Growth Trend:
| 2018 | 2019 | 2020 | 2021 | 2022 | 2023 | |
|---|---|---|---|---|---|---|
| Revenue (M) | $40,522 | $43,165 | $44,611 | $63,495 | $55,554 | $54,041 |
| Operating Margins | 44% | 27% | 38% | 47% | 36% | 27% |
| Net Margins | 34% | 16% | 23% | 36% | 23% | 18% |
| Net Income (M) | $13,925 | $6,972 | $10,400 | $22,597 | $13,048 | $9,953 |
| Net Interest Expense (M) | -$33 | -$648 | -$1,751 | -$26 | -$1,846 | -$1,713 |
| Depreciation & Amort. (M) | $4,015 | $4,384 | $4,279 | $4,697 | $470 | $484 |
| Diluted Shares (M) | 1,659 | 1,659 | 1,256 | 1,256 | 1,256 | 1,256 |
| Earnings Per Share | $7.88 | $4.88 | $6.0 | $12.96 | $7.6 | $6.16 |
| EPS Growth | n/a | -38.07% | 22.95% | 116.0% | -41.36% | -18.95% |
| Avg. Price | $35.21 | $40.26 | $44.97 | $65.16 | $66.34 | $66.02 |
| P/E Ratio | 4.44 | 8.2 | 7.45 | 4.99 | 8.67 | 10.65 |
| Free Cash Flow (M) | $11,821 | $14,912 | $15,875 | $25,345 | $16,134 | $15,160 |
| EV / EBITDA | 2.77 | 4.53 | 2.81 | 2.36 | 4.25 | 5.58 |
| Total Debt (M) | $12,440 | $13,093 | $13,247 | $12,395 | $10,148 | $12,177 |
| Net Debt / EBITDA | 0.08 | 0.32 | 0.14 | -0.01 | 0.17 | 0.16 |
| Current Ratio | 1.91 | 1.56 | 1.8 | 1.93 | 1.64 | 2.06 |
Rio Tinto has an excellent current ratio of 2.06, generally positive cash flows, and healthy leverage levels. However, the firm has declining EPS growth. Finally, we note that Rio Tinto has decent operating margins with a negative growth trend.
The Market May Be Undervaluing Rio Tinto's Assets and Equity:
Rio Tinto has a trailing twelve month P/E ratio of 11.1, compared to an average of 22.71 for the Basic Materials sector. Based on its EPS guidance of $7.38, the company has a forward P/E ratio of 9.3. The -0.9% compound average growth rate of Rio Tinto's historical and projected earnings per share yields a PEG ratio of -11.94. This indicates that its shares are overvalued.In contrast, the market is likely undervaluing Rio Tinto in terms of its equity because its P/B ratio is 1.96 while the sector average is 3.12. The company's shares are currently trading -16.1% above their Graham number.
There's an Analyst Consensus of Strong Upside Potential for Rio Tinto:
The 4 analysts following Rio Tinto have set target prices ranging from $74.0 to $98.0 per share, for an average of $83.5 with a buy rating. The company is trading -20.8% away from its average target price, indicating that there is an analyst consensus of strong upside potential.
The largest shareholder is Wellington Management Group, LLP, whose 2% stake in the company is worth $1,622,478,707.