Now trading at a price of $99.18, Estée Lauder has moved 2.4% so far today.
Estée Lauder returned losses of -44.0% last year, with its stock price reaching a high of $183.2 and a low of $95.87. Over the same period, the stock underperformed the S&P 500 index by -64.8%. AThe company's 50-day average price was $116.12. The Estée Lauder Companies Inc. manufactures, markets, and sells skin care, makeup, fragrance, and hair care products worldwide. Based in New York, NY, the Large-Cap Consumer Discretionary company has 44,020 full time employees. Estée Lauder has offered a 2.7% dividend yield over the last 12 months.
Wider Gross Margins Than the Industry Average of 58.31%:
| 2018 | 2019 | 2020 | 2021 | 2022 | 2023 | |
|---|---|---|---|---|---|---|
| Revenue (M) | $13,683 | $14,863 | $14,294 | $16,215 | $17,737 | $15,910 |
| Gross Margins | 79% | 77% | 75% | 76% | 76% | 71% |
| Net Margins | 8% | 12% | 5% | 18% | 14% | 6% |
| Net Income (M) | $1,117 | $1,794 | $684 | $2,875 | $2,408 | $1,010 |
| Net Interest Expense (M) | $128 | $133 | $161 | $173 | $167 | $255 |
| Depreciation & Amort. (M) | $531 | $557 | $611 | $651 | $727 | $744 |
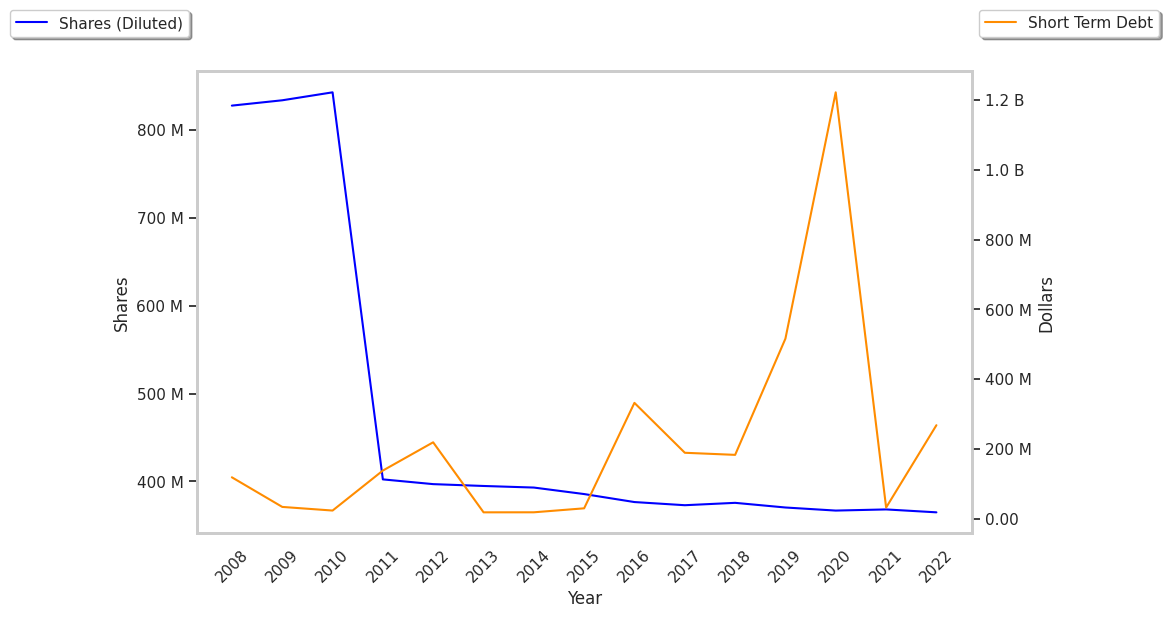
| Diluted Shares (M) | 370 | 367 | 368 | 366 | 360 | 360 |
| Earnings Per Share | $3.02 | $4.89 | $1.86 | $7.86 | $6.68 | $2.81 |
| EPS Growth | n/a | 61.92% | -61.96% | 322.58% | -15.01% | -57.93% |
| Avg. Price | $134.07 | $170.18 | $199.35 | $305.28 | $272.63 | $99.18 |
| P/E Ratio | 44.1 | 34.24 | 104.92 | 38.35 | 40.39 | 35.17 |
| Free Cash Flow (M) | $1,933 | $1,773 | $1,657 | $2,994 | $2,000 | $728 |
| CAPEX (M) | $629 | $744 | $623 | $637 | $1,040 | $1,003 |
| EV / EBITDA | 19.5 | 21.94 | 59.59 | 33.95 | 25.39 | 17.39 |
| Total Debt (M) | $3,391 | $5,178 | $6,135 | $5,291 | $5,379 | $7,637 |
| Net Debt / EBITDA | 0.47 | 0.55 | 0.48 | 0.21 | 0.42 | 1.64 |
| Current Ratio | 1.71 | 1.69 | 1.9 | 1.73 | 1.66 | 1.36 |
Estée Lauder has slight revenue growth and increasing reinvestment in the business, wider gross margins than its peer group, and healthy leverage levels. However, the firm has positive cash flows. Finally, we note that Estée Lauder has flat EPS growth and just enough current assets to cover current liabilities, as shown by its current ratio of 1.36.
Estée Lauder's Valuation Is in Line With Its Sector Averages:
Estée Lauder has a trailing twelve month P/E ratio of 65.2, compared to an average of 22.15 for the Consumer Discretionary sector. Based on its EPS guidance of $4.05, the company has a forward P/E ratio of 28.7. The 4.3% compound average growth rate of Estée Lauder's historical and projected earnings per share yields a PEG ratio of 15.24. This suggests that these shares are overvalued. Furthermore, Estée Lauder is likely overvalued compared to the book value of its equity, since its P/B ratio of 6.19 is higher than the sector average of 3.11. The company's shares are currently trading 213.2% below their Graham number. Ultimately, Estée Lauder's strong cash flows, decent earnings multiple, and healthy debt levels factor towards it being fairly valued, its elevated P/B ratio notwithstanding.
Estée Lauder Has an Average Rating of Hold:
The 25 analysts following Estée Lauder have set target prices ranging from $108.0 to $191.0 per share, for an average of $137.82 with a hold rating. The company is trading -28.0% away from its average target price, indicating that there is an analyst consensus of strong upside potential.
Estée Lauder has an average amount of shares sold short because 2.7% of the company's shares are sold short. Institutions own 91.8% of the company's shares, and the insider ownership rate stands at 0.39%, suggesting a small amount of insider investors. The largest shareholder is Vanguard Group Inc, whose 9% stake in the company is worth $2,051,692,035.