Kimberly-Clark may be undervalued with poor growth indicators, but the 17 analysts following the company give it an rating of hold. Their target prices range from $125.0 to $175.0 per share, for an average of $148.88. At today's price of $140.51, Kimberly-Clark is trading -5.62% away from its average target price, suggesting there is an analyst consensus of some upside potential for the stock.
Kimberly-Clark Corporation, together with its subsidiaries, manufactures and markets personal care and consumer tissue products in the United States. Based in Dallas, TX, the Large-Cap Consumer Discretionary company has 41,000 full time employees. Kimberly-Clark has provided a 3.5% dividend yield over the last 12 months.
Kimberly-Clark has a trailing twelve month P/E ratio of 20.8, compared to an average of 22.15 for the Consumer Discretionary sector. Considering its EPS guidance of $7.6, the company has a forward P/E ratio of 18.5.
Kimberly-Clark is also overpriced compared to its book value, since its P/B ratio of 41.68 is higher than the sector average of 3.11. The company's shares are currently 689.8% below their Graham number, indicating that its shares have a margin of safety.
If analysts are willing to give the company a bad rating despite its potentially attractive valuation, its likely that they are concered by Kimberly-Clark's lacking growth potential, as signaled by its 2.0% rate of revenue growth, and capital expenditures that are only growing at -6.0% on average each year.
| 2018 | 2019 | 2020 | 2021 | 2022 | 2023 | |
|---|---|---|---|---|---|---|
| Revenue (M) | $18,486 | $18,450 | $19,140 | $19,440 | $20,175 | $20,431 |
| Gross Margins | 30% | 33% | 36% | 31% | 31% | 34% |
| Net Margins | 8% | 12% | 12% | 9% | 10% | 9% |
| Net Income (M) | $1,410 | $2,157 | $2,352 | $1,814 | $1,934 | $1,764 |
| Net Interest Expense (M) | $263 | $261 | $252 | $256 | $282 | $293 |
| Depreciation & Amort. (M) | $882 | $917 | $796 | $766 | $754 | $753 |
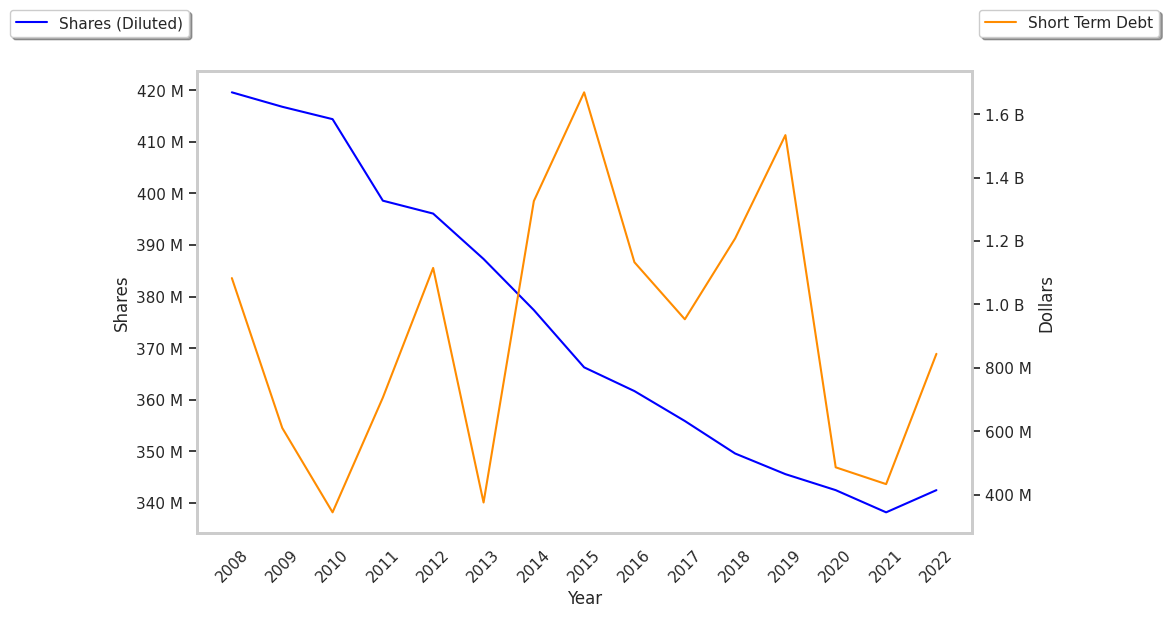
| Diluted Shares (M) | 350 | 346 | 342 | 339 | 338 | 339 |
| Earnings Per Share | $4.03 | $6.24 | $6.87 | $5.35 | $5.72 | $5.21 |
| EPS Growth | n/a | 54.84% | 10.1% | -22.13% | 6.92% | -8.92% |
| Avg. Price | $93.0 | $113.35 | $127.64 | $124.85 | $126.0 | $140.51 |
| P/E Ratio | 22.96 | 18.05 | 18.5 | 23.21 | 21.99 | 26.92 |
| Free Cash Flow (M) | $2,093 | $1,527 | $2,512 | $1,723 | $1,857 | $2,776 |
| CAPEX (M) | $877 | $1,209 | $1,217 | $1,007 | $876 | $766 |
| EV / EBITDA | 12.71 | 11.86 | 12.79 | 15.19 | 14.74 | 17.6 |
| Total Debt (M) | $7,455 | $7,747 | $8,364 | $8,574 | $8,422 | $7,984 |
| Net Debt / EBITDA | 2.22 | 1.87 | 2.0 | 2.5 | 2.33 | 2.23 |
| Current Ratio | 0.77 | 0.73 | 0.8 | 0.82 | 0.78 | 0.82 |


