Now trading at a price of $19.05, AT&T has moved -3.0% so far today.
AT&T returned gains of 40.1% last year, with its stock price reaching a high of $19.99 and a low of $13.92. Over the same period, the stock outperformed the S&P 500 index by 15.3%. More recently, the company's 50-day average price was $18.74. AT&T Inc. provides telecommunications and technology services worldwide. Based in Dallas, TX, the Large-Cap Telecommunications company has 146,040 full time employees. AT&T has offered a 5.7% dividend yield over the last 12 months.
The Company's Revenues Are Declining:
| 2018 | 2019 | 2020 | 2021 | 2022 | 2023 | |
|---|---|---|---|---|---|---|
| Revenue (M) | $170,756 | $181,193 | $143,050 | $134,038 | $120,741 | $122,428 |
| Operating Margins | 15% | 15% | 6% | 19% | -4% | 19% |
| Net Margins | 11% | 8% | -4% | 15% | -7% | 12% |
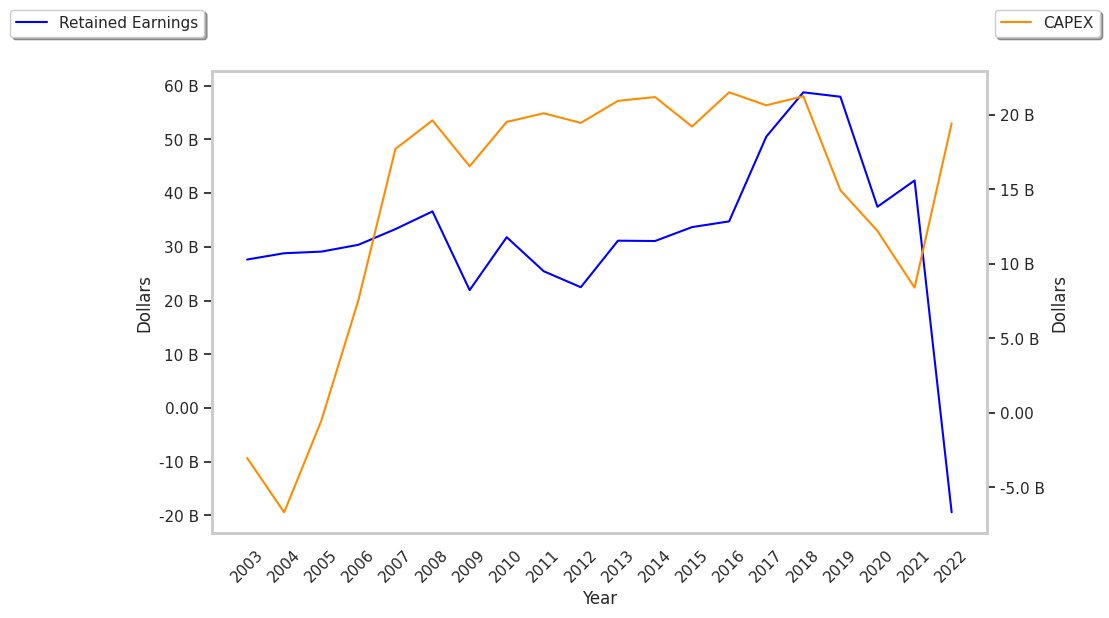
| Net Income (M) | $19,370 | $13,903 | -$5,176 | $20,081 | -$8,524 | $14,400 |
| Net Interest Expense (M) | $7,957 | $8,422 | $7,727 | $6,716 | $6,108 | $6,704 |
| Depreciation & Amort. (M) | $28,430 | $28,217 | $22,523 | $17,852 | $18,021 | $18,777 |
| Diluted Shares (M) | 6,806 | 7,348 | 7,466 | 7,503 | 7,587 | 7,258 |
| Earnings Per Share | $2.85 | $1.89 | -$0.75 | $2.73 | -$1.13 | $1.97 |
| EPS Growth | n/a | -33.68% | -139.68% | 464.0% | -141.39% | 274.34% |
| Avg. Price | $17.99 | $19.55 | $18.98 | $18.35 | $17.72 | $19.05 |
| P/E Ratio | 6.31 | 10.29 | -25.31 | 6.62 | -15.68 | 9.67 |
| Free Cash Flow (M) | $22,351 | $29,033 | $28,440 | $26,412 | $16,186 | $20,461 |
| CAPEX (M) | $21,251 | $19,635 | $14,690 | $15,545 | $19,626 | $17,853 |
| EV / EBITDA | 5.17 | 5.27 | 9.24 | 6.57 | 19.26 | 6.31 |
| Total Debt (M) | $176,505 | $163,147 | $157,245 | $175,631 | $135,890 | $137,331 |
| Net Debt / EBITDA | 3.14 | 2.73 | 4.83 | 3.58 | 9.84 | 3.09 |
| Current Ratio | 0.8 | 0.79 | 0.82 | 1.61 | 0.59 | 0.71 |
AT&T has declining revenues and a flat capital expenditure trend, declining EPS growth, and not enough current assets to cover current liabilities because its current ratio is 0.71. On the other hand, the company has strong operating margins with a stable trend working in its favor. Furthermore, AT&T has positive cash flows and significant leverage levels.
AT&T's Earnings and Assets May Be Undervalued:
AT&T has a trailing twelve month P/E ratio of 10.8, compared to an average of 20.19 for the Telecommunications sector. Based on its EPS guidance of $2.28, the company has a forward P/E ratio of 8.2. The -3.1% compound average growth rate of AT&T's historical and projected earnings per share yields a PEG ratio of -3.43. This indicates that its shares are overvalued.In contrast, the market is likely undervaluing AT&T in terms of its equity because its P/B ratio is 1.3 while the sector average is 2.29.
AT&T Has an Average Rating of Buy:
The 25 analysts following AT&T have set target prices ranging from $12.0 to $29.0 per share, for an average of $21.1 with a buy rating. The company is trading -9.7% away from its average target price, indicating that there is an analyst consensus of some upside potential.
AT&T has a very low short interest because 1.4% of the company's shares are sold short. Institutions own 61.5% of the company's shares, and the insider ownership rate stands at 0.08%, suggesting a small amount of insider investors. The largest shareholder is Vanguard Group Inc, whose 9% stake in the company is worth $11,991,996,845.