Now trading at a price of $205.56, JPMorgan Chase & has moved -5.2% so far today.
JPMorgan Chase & returned gains of 40.4% last year, with its stock price reaching a high of $225.48 and a low of $135.19. Over the same period, the stock outperformed the S&P 500 index by 17.4%. More recently, the company's 50-day average price was $211.03. JPMorgan Chase & Co. operates as a financial services company worldwide. Based in New York, NY, the Large-Cap Finance company has 313,206 full time employees. JPMorgan Chase & has offered a 2.0% dividend yield over the last 12 months.
Generally Positive Cash Flows and Good EPS Growth:
| 2018 | 2019 | 2020 | 2021 | 2022 | 2023 | |
|---|---|---|---|---|---|---|
| Revenue (M) | $108,783 | $115,720 | $119,951 | $121,649 | $128,695 | $158,104 |
| Interest Income (M) | $55,059 | $57,245 | $54,563 | $52,311 | $66,710 | $89,267 |
| Operating Margins | 37% | 39% | 30% | 49% | 36% | 39% |
| Net Margins | 30% | 31% | 24% | 40% | 28% | 31% |
| Net Income (M) | $32,474 | $36,431 | $29,131 | $48,334 | $37,676 | $49,552 |
| Depreciation & Amort. (M) | $7,791 | $8,368 | $8,614 | $7,932 | $7,051 | $7,512 |
| Diluted Shares (M) | 3,414 | 3,230 | 3,087 | 3,027 | 2,970 | 2,943 |
| Earnings Per Share | $9.0 | $10.72 | $8.88 | $15.36 | $12.09 | $16.23 |
| EPS Growth | n/a | 19.11% | -17.16% | 72.97% | -21.29% | 34.24% |
| Avg. Price | $94.9 | $100.45 | $97.08 | $146.27 | $129.11 | $205.56 |
| P/E Ratio | 10.5 | 9.34 | 10.92 | 9.5 | 10.67 | 12.65 |
| Free Cash Flow (M) | $15,614 | $4,092 | -$79,910 | $78,084 | $107,119 | $12,974 |
| EV / EBITDA | 6.77 | 6.7 | 1.18 | 0.1 | 2.06 | 5.39 |
| Total Debt (M) | $282,031 | $291,498 | $281,685 | $301,005 | $295,865 | $391,825 |
| Net Debt / EBITDA | 0.07 | 0.52 | -5.54 | -6.52 | -5.1 | -3.36 |
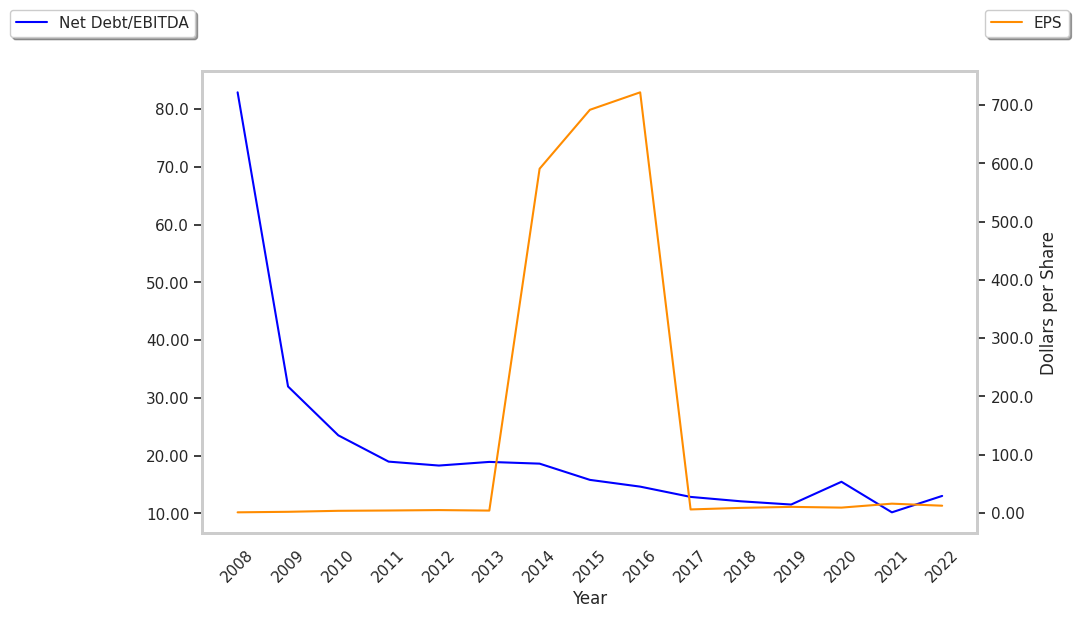
JPMorgan Chase & has strong net margins with a stable trend and generally positive cash flows. Additionally, the company's financial statements display low leverage levels and a strong EPS growth trend.
JPMorgan Chase & Is Currently Under Priced:
JPMorgan Chase & has a trailing twelve month P/E ratio of 11.8, compared to an average of 19.48 for the Finance sector. Based on its EPS guidance of $15.37, the company has a forward P/E ratio of 13.7. The 7.9% compound average growth rate of JPMorgan Chase &'s historical and projected earnings per share yields a PEG ratio of 1.48. This implies that the shares are fairly valued. The market is placing a fair value on JPMorgan Chase &'s equity, since its P/B ratio of 1.85 is comparable to its sector average of 1.85. The company's shares are currently trading 1.9% below their Graham number.
There's an Analyst Consensus of Little Upside Potential for JPMorgan Chase &:
The 23 analysts following JPMorgan Chase & have set target prices ranging from $142.88 to $218.35 per share, for an average of $196.84 with a buy rating. The company is trading 4.4% away from its average target price, indicating that there is an analyst consensus of little upside potential.
JPMorgan Chase & has a very low short interest because 0.9% of the company's shares are sold short. Institutions own 73.8% of the company's shares, and the insider ownership rate stands at 0.45%, suggesting a small amount of insider investors. The largest shareholder is Vanguard Group Inc, whose 10% stake in the company is worth $55,781,467,447.


