A strong performer from today's morning trading session is Southwest Airlines, whose shares rose 2.7% to $30.38 per share. For those of you thinking about investing in the stock, here is a brief value analysis of the stock using the company's basic fundamental ratios.
a Lower P/B Ratio Than Its Sector Average but Trading Above Its Fair Price:
Southwest Airlines Co. operates as a passenger airline company that provides scheduled air transportation services in the United States and near-international markets. The company belongs to the Consumer Discretionary sector, which has an average price to earnings (P/E) ratio of 22.6 and an average price to book (P/B) ratio of 3.19. In contrast, Southwest Airlines has a trailing 12 month P/E ratio of 233.7 and a P/B ratio of 1.74.
Southwest Airlines's PEG ratio is 5.64, which shows that the stock is probably overvalued in terms of its estimated growth. For reference, a PEG ratio near or below 1 is a potential signal that a company is undervalued.
Increasing Revenues but Narrowing Margins:
| 2018 | 2019 | 2020 | 2021 | 2022 | 2023 | |
|---|---|---|---|---|---|---|
| Revenue (M) | $21,965 | $22,428 | $9,048 | $15,790 | $23,814 | $26,091 |
| Operating Margins | 15% | 13% | -42% | 11% | 4% | 1% |
| Net Margins | 11% | 10% | -34% | 6% | 2% | 2% |
| Net Income (M) | $2,465 | $2,300 | -$3,074 | $977 | $539 | $465 |
| Net Interest Expense (M) | $131 | $118 | $349 | $467 | $340 | $259 |
| Depreciation & Amort. (M) | $1,201 | $1,219 | $1,255 | $1,272 | $1,351 | $1,522 |
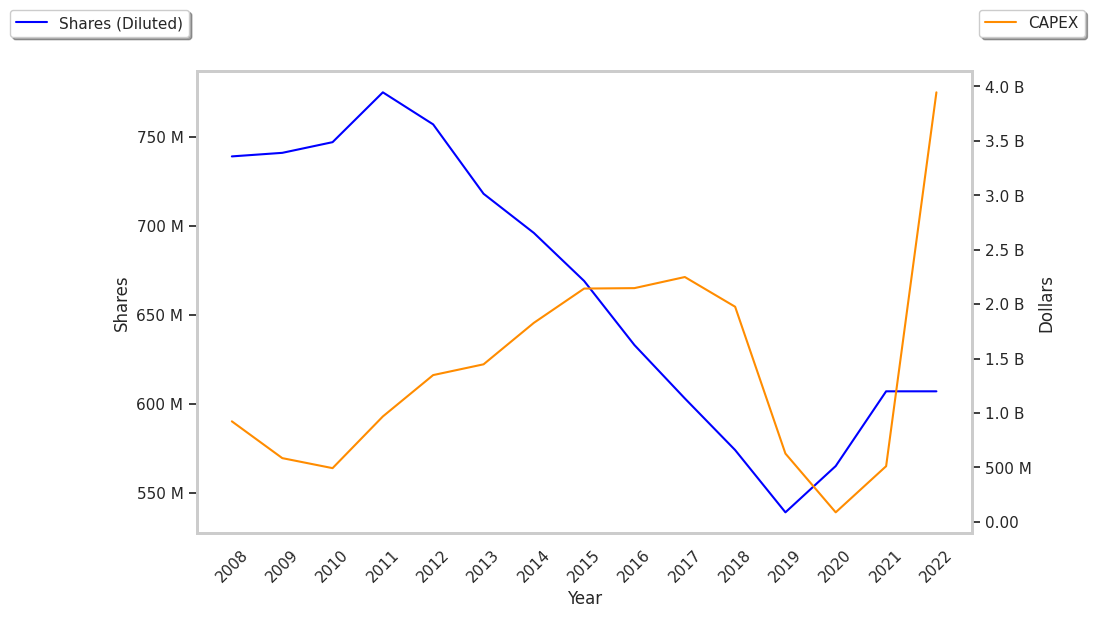
| Diluted Shares (M) | 574 | 539 | 565 | 609 | 642 | 640 |
| Earnings Per Share | $4.29 | $4.27 | -$5.44 | $1.61 | $0.87 | $0.76 |
| EPS Growth | n/a | -0.47% | -227.4% | 129.6% | -45.96% | -12.64% |
| Avg. Price | $53.87 | $51.68 | $39.35 | $51.8 | $42.54 | $30.36 |
| P/E Ratio | 12.53 | 12.07 | -7.23 | 31.39 | 46.75 | 38.92 |
| Free Cash Flow (M) | $2,971 | $2,960 | -$1,642 | $1,817 | -$134 | -$356 |
| CAPEX (M) | $1,922 | $1,027 | $515 | $505 | $3,924 | $3,520 |
| EV / EBITDA | 8.02 | 7.11 | -11.52 | 12.92 | 13.43 | 14.15 |
| Total Debt (M) | $5,542 | $3,692 | $20,222 | $20,548 | $16,092 | $15,956 |
| Net Debt / EBITDA | 0.84 | 0.27 | -3.58 | 2.7 | 2.79 | 3.82 |
| Current Ratio | 0.64 | 0.67 | 2.02 | 1.97 | 1.43 | 1.14 |
Southwest Airlines's financial statements include several red flags such as weak operating margins with a negative growth trend, declining EPS growth, and positive cash flows. Additionally, the firm has a highly leveraged balance sheet. On the other hand, the company has growing revenues and increasing reinvestment in the business working in its favor. Furthermore, Southwest Airlines has just enough current assets to cover current liabilities, as shown by its current ratio of 1.14.