It's been a great morning session for Capital One Financial investors, who saw their shares rise 5.7% to a price of $153.44 per share. At these higher prices, is the company still fairly valued? If you are thinking about investing, make sure to check the company's fundamentals before making a decision.
Capital One Financial Is Potentially Undervalued and Potentially Undervalued:
Capital One Financial Corporation operates as the financial services holding company for the Capital One, National Association, which engages in the provision of various financial products and services in the United States, Canada, and the United Kingdom. The company belongs to the Finance sector, which has an average price to earnings (P/E) ratio of 20.04 and an average price to book (P/B) ratio of 1.86. In contrast, Capital One Financial has a trailing 12 month P/E ratio of 14.4 and a P/B ratio of 1.1.
When we divide Capital One Financial's P/E ratio by its expected EPS growth rate of the next five years, we obtain its PEG ratio of -11.44. Since it's negative, the company has negative growth expectations, and most investors will probably avoid the stock unless it has an exceptionally low P/E and P/B ratio.
Generally Positive Cash Flows and a Positive EPS Growth Rate:
| 2018 | 2019 | 2020 | 2021 | 2022 | 2023 | |
|---|---|---|---|---|---|---|
| Revenue (M) | $27,176 | $28,513 | $26,033 | $25,769 | $31,237 | $41,938 |
| Interest Income (M) | $22,875 | $23,340 | $22,913 | $24,171 | $27,114 | $29,241 |
| Operating Margins | 27% | 24% | 12% | 61% | 30% | 14% |
| Net Margins | 22% | 19% | 10% | 48% | 24% | 12% |
| Net Income (M) | $6,015 | $5,546 | $2,714 | $12,390 | $7,360 | $4,887 |
| Depreciation & Amort. (M) | $2,396 | $3,339 | $3,501 | $3,481 | $3,210 | $3,226 |
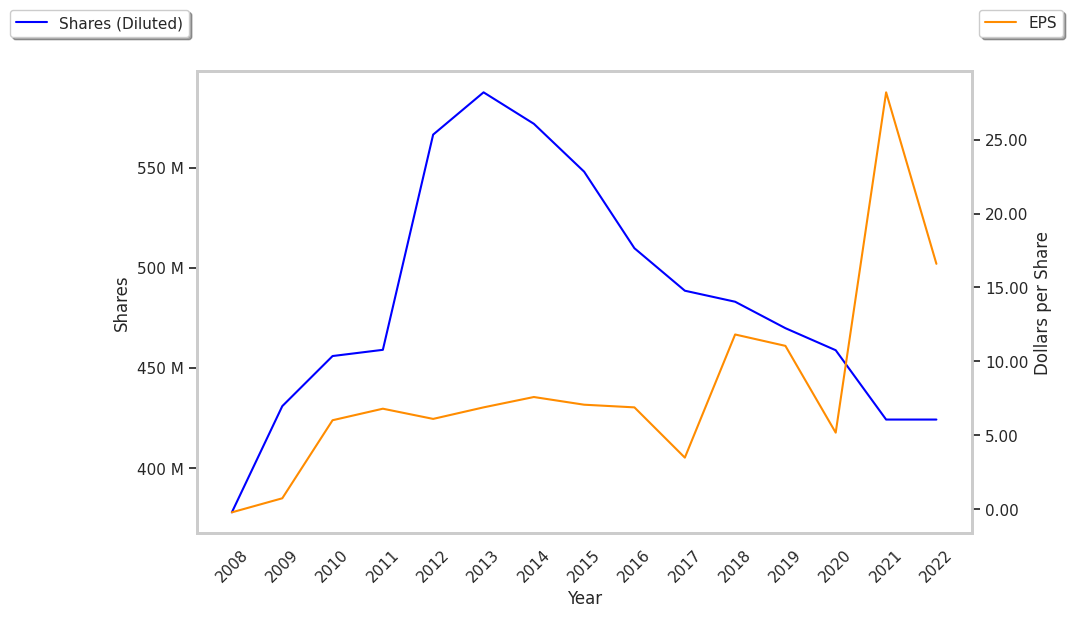
| Diluted Shares (M) | 320 | 230 | 110 | 444 | 393 | 383 |
| Earnings Per Share | $11.82 | $11.05 | $5.18 | $26.94 | $17.91 | $11.95 |
| EPS Growth | n/a | -6.51% | -53.12% | 420.08% | -33.52% | -33.28% |
| Avg. Price | $86.49 | $83.33 | $71.55 | $141.14 | $129.38 | $153.44 |
| P/E Ratio | 7.27 | 7.51 | 13.79 | 5.22 | 7.2 | 12.81 |
| Free Cash Flow (M) | $12,104 | $15,752 | $15,989 | $11,612 | $12,875 | $19,614 |
| CAPEX (M) | $874 | $887 | $710 | $698 | $934 | $961 |
| EV / EBITDA | 8.07 | 7.24 | 4.78 | 4.41 | 5.63 | 6.91 |
| Total Debt (M) | $49,503 | $48,383 | $39,871 | $42,266 | $47,832 | $49,318 |
| Net Debt / EBITDA | 3.74 | 3.42 | -0.1 | 1.05 | 1.33 | 0.6 |
Capital One Financial has generally positive cash flows and low leverage levels. Additionally, the company's financial statements display growing revenues and a flat capital expenditure trend and positive EPS growth. However, the firm has weak net margins with a negative growth trend.