Oil & Gas Transportation and Processing company Williams is standing out today, surging to $57.63 and marking a 5.1% change. In comparison the S&P 500 moved only 1.0%.
WMB currently sits within range of its analyst target price of $57.51, which implies that its price may remain stable for the near future.
Surprisingly, analysts give the stock an average rating of buy, which shows that they believe prices could continue to move. Over the last year, Williams shares have outperformed the S&P 500 by 40.0%, with a price change of 60.3%.
The Williams Companies, Inc., together with its subsidiaries, operates as an energy infrastructure company primarily in the United States. The company is a utility, providing a public service and subject to extensive regulations. As stocks, utility companies are favored because they generally offer generous dividends, and their price usually demonstrates some resistance to market volatility.
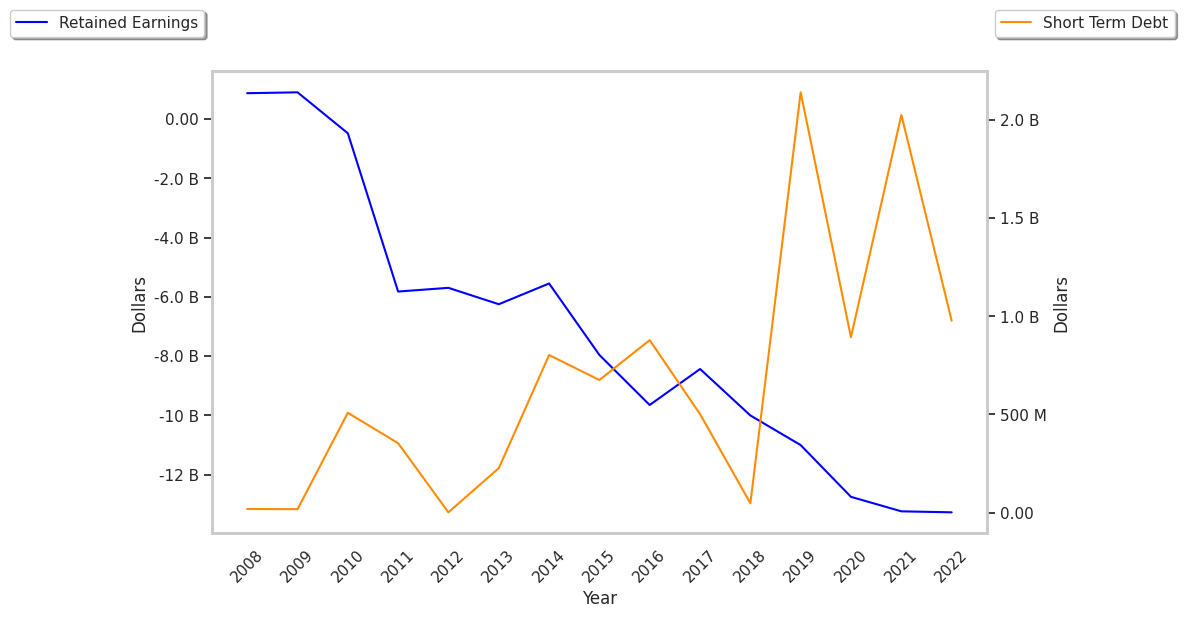
On the other hand, these companies tend to accumulate large amounts of debt in order to fund their massive infrastructure investments, which makes their financial prospects highly sensitive to interest rate changes. Even small increases in interest rates can vastly increase their indebtedness. Another risk facing this sector is how it can adapt to new federal clean energy regulations and a shift towards renewables.
Williams's trailing 12 month P/E ratio is 31.7, based on its trailing EPS of $1.82. The company has a forward P/E ratio of 24.5 according to its forward EPS of $2.09 -- which is an estimate of what its earnings will look like in the next quarter.
As of the third quarter of 2024, the average Price to Earnings (P/E) ratio for US utilities companies is 20.52, and the S&P 500 has an average of 29.3. The P/E ratio consists in the stock's share price divided by its earnings per share (EPS), representing how much investors are willing to spend for each dollar of the company's earnings. Earnings are the company's revenues minus the cost of goods sold, overhead, and taxes.
Another key to assessing a company's health is to look at its free cash flow, which is calculated on the basis of its total cash flow from operating activities minus its capital expenditures. Capital expenditures are the costs of maintaining fixed assets such as land, buildings, and equipment. From Williams's last four annual reports, we are able to obtain the following rundown of its free cash flow:
| Date Reported | Cash Flow from Operations ($ k) | Capital expenditures ($ k) | Free Cash Flow ($ k) | YoY Growth (%) |
|---|---|---|---|---|
| 2023 | 5,938,000 | 2,516,000 | 3,422,000 | 29.82 |
| 2022 | 4,889,000 | 2,253,000 | 2,636,000 | -2.59 |
| 2021 | 3,945,000 | 1,239,000 | 2,706,000 | 19.89 |
| 2020 | 3,496,000 | 1,239,000 | 2,257,000 | 42.49 |
| 2019 | 3,693,000 | 2,109,000 | 1,584,000 | 4181.08 |
| 2018 | 3,293,000 | 3,256,000 | 37,000 |
- Average free cash flow: $2.11 Billion
- Average free cash flown growth rate: 33.4 %
- Coefficient of variability (the lower the better): 0.0 %
Free cash flow represents the amount of money that is available for reinvesting in the business, or for paying out to investors in the form of a dividend. With a positive cash flow as of the last fiscal year, WMB is in a position to do either -- which can encourage more investors to place their capital in the company.
Another valuation metric for analyzing a stock is its Price to Book (P/B) Ratio, which consists in its share price divided by its book value per share. The book value refers to the present liquidation value of the company, as if it sold all of its assets and paid off all debts.
Williams's P/B ratio indicates that the market value of the company exceeds its book value by a factor of 5, so the company's assets may be overvalued compared to the average P/B ratio of the Utilities sector, which stands at 2.2 as of the third quarter of 2024.
Williams is by most measures fairly valued because it has a higher P/E ratio than its sector average, a higher than Average P/B Ratio, and generally positive cash flows with an upwards trend. The stock has mixed growth prospects because it has a an above average PEG ratio and strong operating margins with a positive growth rate. We hope you enjoyed this overview of WMB's fundamentals.