Standing out among the Street's worst performers today is TC Energy, a oil & gas transportation and processing company whose shares slumped -3.5% to a price of $45.75, not far from its average analyst target price of $45.03.
The average analyst rating for the stock is buy. TRP lagged the S&P 500 index by -3.0% so far today and by -2.2% over the last year, returning 19.9%.
TC Energy Corporation operates as an energy infrastructure company in North America. The company is a utility, providing a public service and subject to extensive regulations. As stocks, utility companies are favored because they generally offer generous dividends, and their price usually demonstrates some resistance to market volatility.
On the other hand, these companies tend to accumulate large amounts of debt in order to fund their massive infrastructure investments, which makes their financial prospects highly sensitive to interest rate changes. Even small increases in interest rates can vastly increase their indebtedness. Another risk facing this sector is how it can adapt to new federal clean energy regulations and a shift towards renewables.
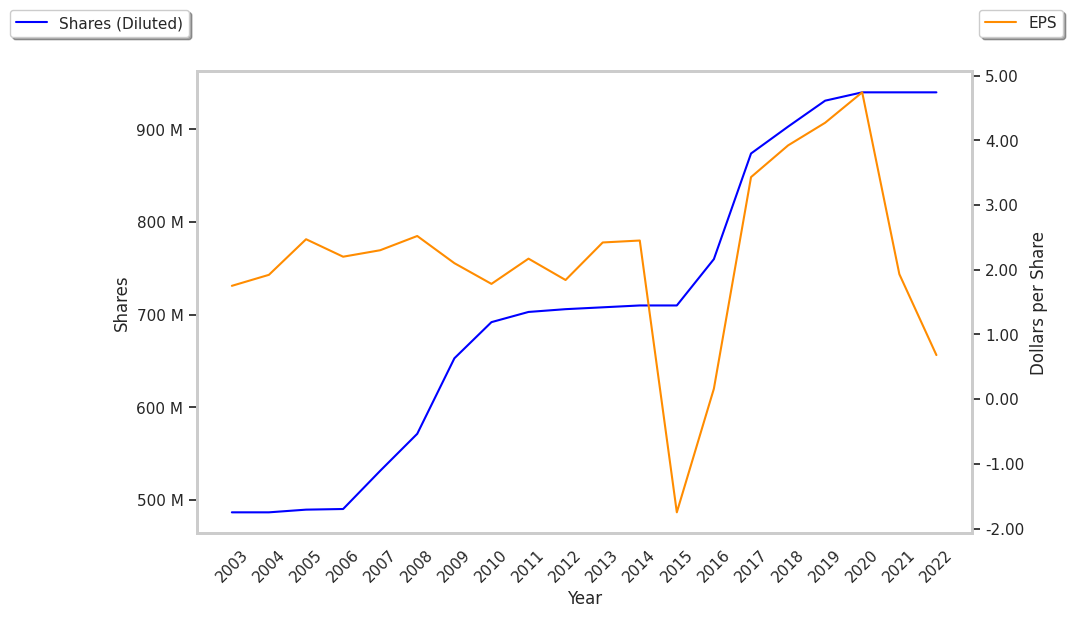
TC Energy's trailing 12 month P/E ratio is 13.3, based on its trailing EPS of $3.44. The company has a forward P/E ratio of 11.1 according to its forward EPS of $2.65 -- which is an estimate of what its earnings will look like in the next quarter. The P/E ratio is the company's share price divided by its earnings per share. In other words, it represents how much investors are willing to spend for each dollar of the company's earnings (revenues minus the cost of goods sold, taxes, and overhead). As of the third quarter of 2024, the utilities sector has an average P/E ratio of 20.52, and the average for the S&P 500 is 29.3.
When we subtract capital expenditures from operating cash flows, we are left with the company's free cash flow, which for TC Energy was $-5030000000 as of its last annual report. The balance of cash flows represents the capital that is available for re-investment in the business, or for payouts to equity investors as dividends. The company's average cash flow over the last 4 years has been $-2159666666.7 and they've been growing at an average rate of -25.3%. TRP's weak free cash flow trend shows that it might not be able to sustain its dividend payments, which over the last 12 months has yielded 8.0% to investors. Cutting the dividend can compound a company's problems by causing investors to sell their shares, which further pushes down its stock price.
Another valuation metric for analyzing a stock is its Price to Book (P/B) Ratio, which consists in its share price divided by its book value per share. The book value refers to the present liquidation value of the company, as if it sold all of its assets and paid off all debts). Tc energy's P/B ratio indicates that the market value of the company exceeds its book value by a factor of 1.7, but is still below the average P/B ratio of the Utilities sector, which stood at 2.2 as of the third quarter of 2024.
TC Energy is likely overvalued at today's prices because it has a Very low P/E ratio, a lower P/B ratio than its sector average, and negative cash flows with a downwards trend. The stock has poor growth indicators because of its decent operating margins with a stable trend, and a negative PEG ratio. We hope this preliminary analysis will encourage you to do your own research into TRP's fundamental values -- especially their trends over the last few years, which provide the clearest picture of the company's valuation.