Dominion Energy may be undervalued with poor growth indicators, but the 16 analysts following the company give it an rating of hold. Their target prices range from $50.73 to $66.0 per share, for an average of $58.48. At today's price of $57.43, Dominion Energy is trading -1.8% away from its average target price, suggesting there is an analyst consensus of some upside potential for the stock.
Dominion Energy, Inc. produces and distributes energy in the United States. The Large-Cap Utilities company is based in Richmond, VA. Dominion Energy has provided a 4.7% dividend yield over the last 12 months.
Dominion Energy has a trailing twelve month P/E ratio of 26.1, compared to an average of 20.52 for the Utilities sector. Considering its EPS guidance of $3.38, the company has a forward P/E ratio of 17.0.
On the other hand, the market is potentially undervaluing Dominion Energy in terms of its book value because its P/B ratio is 1.84. In comparison, the sector average P/B ratio is 2.2. The company's shares are currently 39.5% below their Graham number, indicating that its shares have a margin of safety.
Why would analysts be giving such an undervalued stock a bad rating? It's possible that analysts are looking beyond common valuation metrics and taking into account the company's potentially irresponsible use of debt to operate its business. Dominion Energy's negative EPS growth rate of None% is another drawback.
| 2018 | 2019 | 2020 | 2021 | 2022 | 2023 | |
|---|---|---|---|---|---|---|
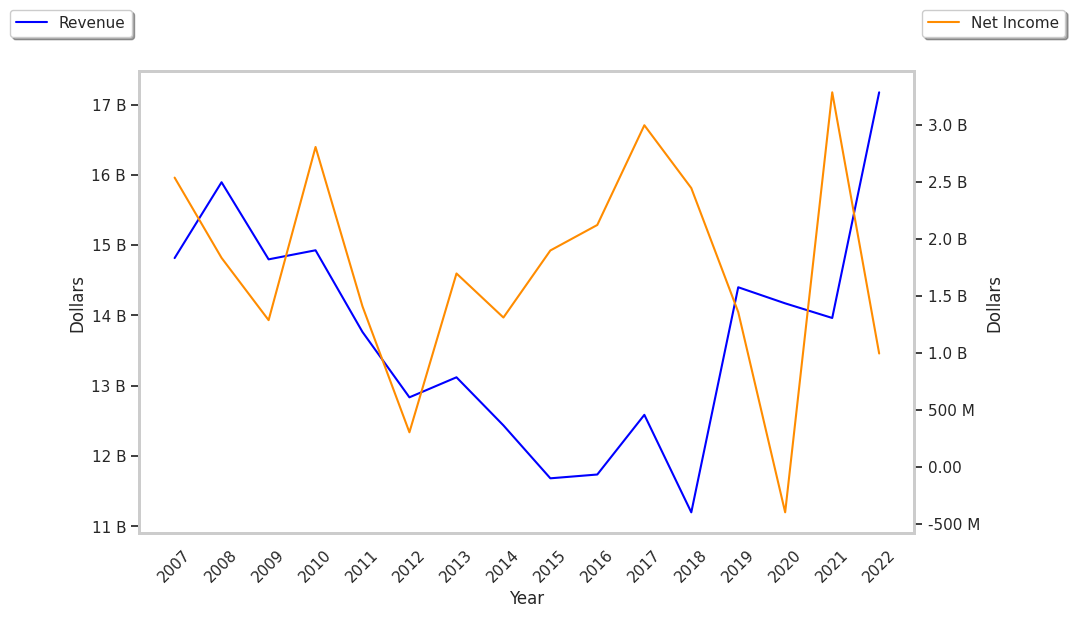
| Revenue (M) | $11,199 | $14,401 | $11,919 | $11,419 | $13,938 | $14,393 |
| Operating Margins | 27% | 11% | 12% | 17% | 10% | 24% |
| Net Margins | 22% | 9% | -3% | 30% | 9% | 14% |
| Net Income (M) | $2,447 | $1,358 | -$401 | $3,399 | $1,321 | $1,994 |
| Net Interest Expense (M) | $1,279 | $1,486 | $1,339 | $1,255 | $1,002 | $1,674 |
| Depreciation & Amort. (M) | $1,660 | $2,283 | $1,991 | $2,117 | $2,442 | $2,580 |
| Diluted Shares (M) | 655 | 8,089 | 831 | 808 | 825 | 836 |
| Earnings Per Share | $3.74 | $1.62 | -$0.57 | $4.12 | $1.49 | $2.29 |
| EPS Growth | n/a | -56.68% | -135.19% | 822.81% | -63.83% | 53.69% |
| Avg. Price | $57.29 | $65.59 | $71.14 | $69.64 | $77.14 | n/a |
| P/E Ratio | 15.32 | 39.51 | -127.04 | 16.9 | 51.77 | nan |
| Free Cash Flow (M) | $519 | $224 | $5,227 | $4,037 | $3,700 | $6,572 |
| EV / EBITDA | 14.6 | 34.96 | 27.55 | 22.0 | 25.28 | nan |
| Total Debt (M) | $31,154 | $29,060 | $34,002 | $34,592 | $35,525 | $33,703 |
| Net Debt / EBITDA | 6.61 | 7.56 | 9.97 | 8.35 | 9.14 | 5.59 |
| Current Ratio | 0.67 | 0.61 | 0.64 | 0.84 | 0.73 | 1.04 |