Charles River Laboratories International may be undervalued with mixed growth prospects, but the 19 analysts following the company give it an rating of hold. Their target prices range from $130.0 to $260.12 per share, for an average of $182.69. At today's price of $170.15, Charles River Laboratories International is trading -6.86% away from its average target price, suggesting there is an analyst consensus of some upside potential for the stock.
Charles River Laboratories International, Inc. provides drug discovery, non-clinical development, and safety testing services in the United States, Europe, Canada, the Asia Pacific, and internationally. Based in Wilmington, MA, the Mid-Cap Health Care company has 18,700 full time employees. Charles River Laboratories International has not offered a regular dividend during the last year.
Charles River Laboratories International has a trailing twelve month P/E ratio of 850.8, compared to an average of 26.07 for the Health Care sector. Considering its EPS guidance of $10.28, the company has a forward P/E ratio of 16.6.
On the other hand, the market is potentially undervaluing Charles River Laboratories International in terms of its book value because its P/B ratio is 2.51. In comparison, the sector average P/B ratio is 3.53. The company's shares are currently 41.3% below their Graham number, indicating that its shares have a margin of safety.
| 2018 | 2019 | 2020 | 2021 | 2022 | 2023 | |
|---|---|---|---|---|---|---|
| Revenue (M) | $2,266 | $2,621 | $2,924 | $3,540 | $3,976 | $4,129 |
| Operating Margins | 15% | 13% | 15% | 17% | 16% | 15% |
| Net Margins | 10% | 10% | 12% | 11% | 12% | 11% |
| Net Income (M) | $226 | $252 | $364 | $391 | $493 | $475 |
| Net Interest Expense (M) | $64 | $61 | $86 | $74 | -$59 | $137 |
| Depreciation & Amort. (M) | $162 | $198 | $235 | $266 | $304 | $314 |
| Diluted Shares (M) | 49 | 50 | 51 | 51 | 51 | 51 |
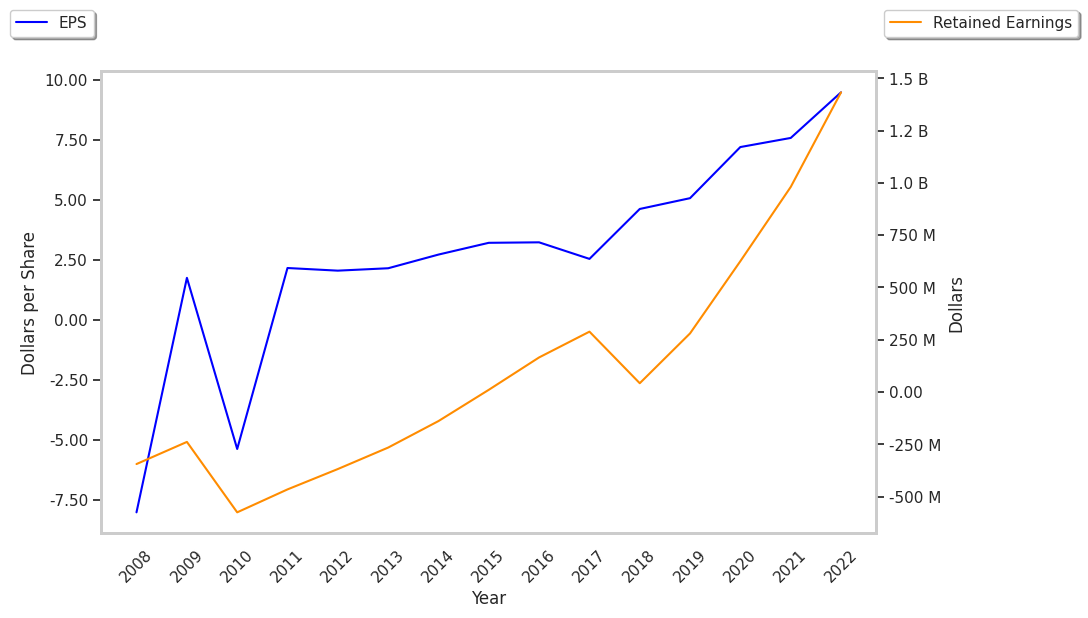
| Earnings Per Share | $4.62 | $5.07 | $7.2 | $7.6 | $9.6 | $9.22 |
| EPS Growth | n/a | 9.74% | 42.01% | 5.56% | 26.32% | -3.96% |
| Avg. Price | $116.17 | $134.93 | $189.24 | $354.91 | $274.39 | n/a |
| P/E Ratio | 24.61 | 26.1 | 25.75 | 45.68 | 28.11 | nan |
| Free Cash Flow (M) | $117 | $40 | $380 | $532 | $295 | $365 |
| CAPEX (M) | $140 | $141 | $167 | $229 | $325 | $319 |
| EV / EBITDA | 14.11 | 14.85 | 16.5 | 23.49 | 17.61 | nan |
| Total Debt (M) | $1,642 | $1,888 | $1,980 | $2,666 | $2,708 | $2,647 |
| Net Debt / EBITDA | 2.93 | 3.0 | 2.62 | 2.84 | 2.67 | 2.55 |
| Current Ratio | 1.61 | 1.44 | 1.43 | 1.23 | 1.32 | 1.52 |