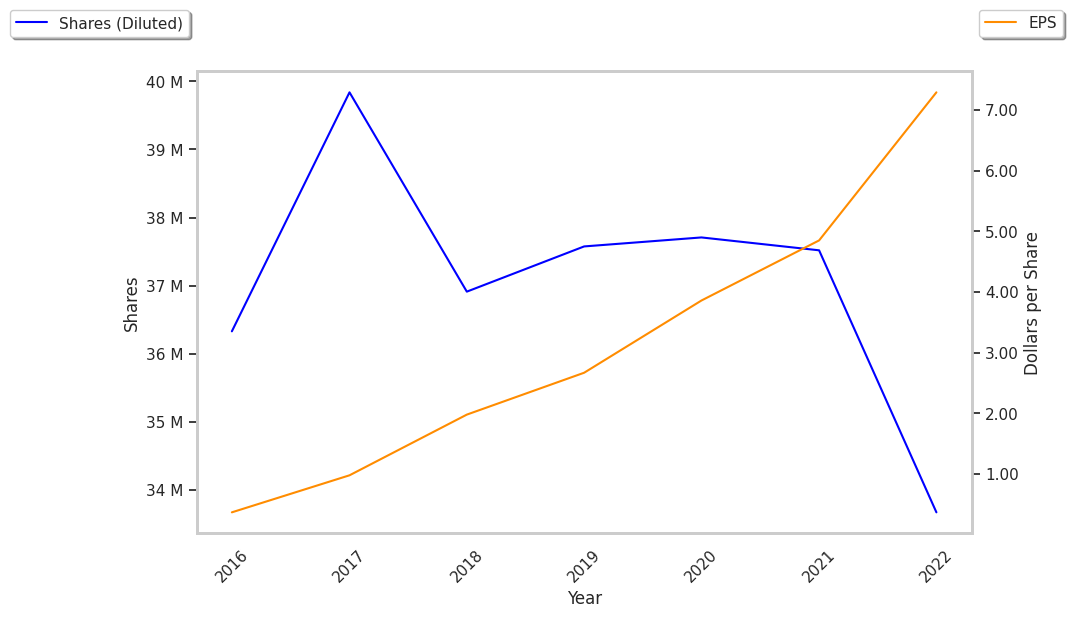
Biotechnology company Medpace is standing out today, surging to $296.06 and marking a 4.9% change. In comparison the S&P 500 moved only 3.0%.
MEDP currently sits within range of its analyst target price of $311.39, which implies that its price may remain stable for the near future. Indeed, the average analayst rating for the stock is hold. Over the last year, Medpace has underperfomed the S&P 500 by 33.3%, moving -29.0%.
Medpace Holdings, Inc. provides clinical research-based drug and medical device development services in North America, Europe, and Asia. The company is part of the healthcare sector. Healthcare companies work in incredibly complex markets, and their valuations can change in an instant based on a denied drug approval, a research and development breakthrough at a competitor, or a new government regulation. In the longer term, healthcare companies are affected by factors as varied as demographics and epidemiology. Investors who want to understand the healthcare market should be prepared for deep dives into a wide range of topics.
Medpace's trailing 12 month P/E ratio is 22.6, based on its trailing EPS of $13.1. The company has a forward P/E ratio of 21.9 according to its forward EPS of $12.49 -- which is an estimate of what its earnings will look like in the next quarter.
The P/E ratio is the company's share price divided by its earnings per share. In other words, it represents how much investors are willing to spend for each dollar of the company's earnings (revenues minus the cost of goods sold, taxes, and overhead). As of the third quarter of 2024, the health care sector has an average P/E ratio of 26.07, and the average for the S&P 500 is 29.3.
Another key to assessing a company's health is to look at its free cash flow, which is calculated on the basis of its total cash flow from operating activities minus its capital expenditures. Capital expenditures are the costs of maintaining fixed assets such as land, buildings, and equipment. From Medpace's last four annual reports, we are able to obtain the following rundown of its free cash flow:
| Date Reported | Cash Flow from Operations ($ k) | Capital expenditures ($ k) | Free Cash Flow ($ k) | YoY Growth (%) |
|---|---|---|---|---|
| 2024 | 608,815 | 36,548 | 572,267 | 44.25 |
| 2023 | 433,374 | 36,648 | 396,726 | 12.97 |
| 2022 | 388,050 | 36,879 | 351,171 | 49.4 |
| 2021 | 263,327 | 28,271 | 235,056 | 3.4 |
| 2020 | 258,676 | 31,340 | 227,336 | 23.58 |
| 2019 | 201,867 | 17,912 | 183,955 |
- Average free cash flow: $327.75 Million
- Average free cash flown growth rate: 22.7 %
- Coefficient of variability (the lower the better): 0.0 %
Free cash flow represents the amount of money that is available for reinvesting in the business, or for paying out to investors in the form of a dividend. With a positive cash flow as of the last fiscal year, MEDP is in a position to do either -- which can encourage more investors to place their capital in the company.
Another valuation metric for analyzing a stock is its Price to Book (P/B) Ratio, which consists in its share price divided by its book value per share. The book value refers to the present liquidation value of the company, as if it sold all of its assets and paid off all debts.
Medpace's P/B ratio indicates that the market value of the company exceeds its book value by a factor of 14, so the company's assets may be overvalued compared to the average P/B ratio of the Health Care sector, which stands at 3.53 as of the third quarter of 2024.
With a Very low P/E ratio, a higher than Average P/B Ratio, and generally positive cash flows with an upwards trend, we can conclude that Medpace is probably fairly valued at current prices. The stock presents mixed growth prospects because of its decent operating margins with a stable trend, and an inflated PEG ratio.


