Accenture logged a 2.6% change during today's afternoon session, and is now trading at a price of $255.59 per share.
Accenture returned losses of -24.6% last year, with its stock price reaching a high of $398.35 and a low of $236.67. Over the same period, the stock underperformed the S&P 500 index by -39.8%. AThe company's 50-day average price was $283.12. Accenture plc provides strategy and consulting, industry X, song, and technology and operation services in North America, Europe, the Middle East, Africa, and internationally. Based in Dublin, Ireland, the Large-Cap Real Estate company has 791,000 full time employees. Accenture has offered a 2.4% dividend yield over the last 12 months.
Growing Revenues and an Average Current Ratio:
| 2019 | 2020 | 2021 | 2022 | 2023 | 2024 | |
|---|---|---|---|---|---|---|
| Revenue (M) | $43,215 | $44,327 | $50,533 | $61,594 | $64,112 | $64,896 |
| Operating Margins | 15% | 15% | 15% | 15% | 14% | 15% |
| Net Margins | 11% | 12% | 12% | 11% | 11% | 11% |
| Net Income (M) | $4,779 | $5,108 | $5,907 | $6,877 | $6,872 | $7,265 |
| Net Interest Expense (M) | $23 | $33 | $59 | $47 | $48 | $59 |
| Depreciation & Amort. (M) | $893 | $1,773 | $1,891 | $2,088 | $2,281 | $548 |
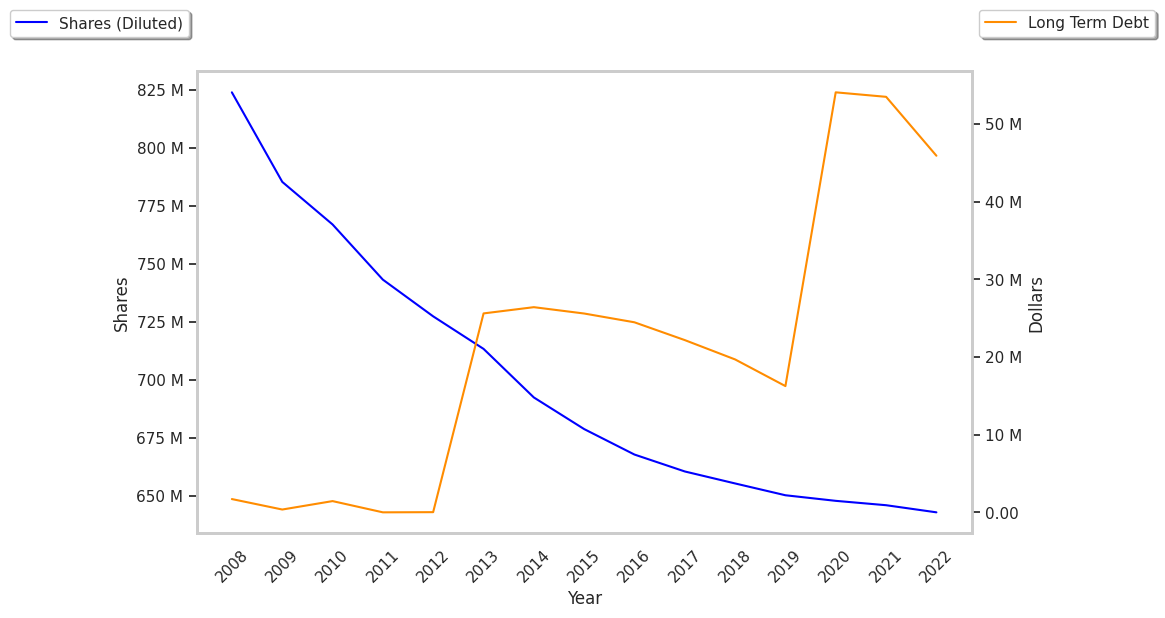
| Diluted Shares (M) | 649 | 647 | 645 | 639 | 637 | 635 |
| Earnings Per Share | $7.36 | $7.89 | $9.16 | $10.71 | $10.77 | $11.44 |
| EPS Growth | n/a | 7.2% | 16.1% | 16.92% | 0.56% | 6.22% |
| Avg. Price | $171.86 | $204.62 | $301.47 | $311.69 | $350.91 | $254.03 |
| P/E Ratio | 22.95 | 25.48 | 32.38 | 28.67 | 32.19 | 21.96 |
| Free Cash Flow (M) | $6,028 | $7,616 | $8,395 | $8,823 | $8,996 | $8,615 |
| CAPEX (M) | $599 | $599 | $580 | $718 | $528 | $517 |
| EV / EBITDA | 14.85 | 15.25 | 20.24 | 17.59 | 20.41 | 16.54 |
| Total Debt (M) | $20 | $69 | $65 | $55 | $147 | $5,154 |
| Net Debt / EBITDA | -0.8 | -1.03 | -0.59 | -0.51 | -0.63 | -0.31 |
| Current Ratio | 1.39 | 1.45 | 1.22 | 1.26 | 1.33 | 1.47 |
Accenture has growing revenues and a flat capital expenditure trend and positive EPS growth. Additionally, the company's financial statements display generally positive cash flows and healthy leverage levels. However, the firm has weak operating margins with a stable trend. Finally, we note that Accenture has just enough current assets to cover current liabilities, as shown by its current ratio of 1.47.
a Very Low P/E Ratio but Trading Above Its Fair Price:
Accenture has a trailing twelve month P/E ratio of 22.5, compared to an average of 27.31 for the Real Estate sector. Based on its EPS guidance of $14.07, the company has a forward P/E ratio of 20.1. The 9.7% compound average growth rate of Accenture's historical and projected earnings per share yields a PEG ratio of 2.32. This suggests that these shares are overvalued. Furthermore, Accenture is likely overvalued compared to the book value of its equity, since its P/B ratio of 5.21 is higher than the sector average of 1.94. The company's shares are currently trading 134.9% below their Graham number. Ultimately, Accenture's strong cash flows, decent earnings multiple, and healthy debt levels factor towards it being fairly valued, its elevated P/B ratio notwithstanding.
There's an Analyst Consensus of Strong Upside Potential for Accenture:
The 22 analysts following Accenture have set target prices ranging from $240.0 to $372.0 per share, for an average of $324.86 with a buy rating. The company is trading -21.3% away from its average target price, indicating that there is an analyst consensus of strong upside potential.
Accenture has an average amount of shares sold short because 2.0% of the company's shares are sold short. Institutions own 82.2% of the company's shares, and the insider ownership rate stands at 0.08%, suggesting a small amount of insider investors. The largest shareholder is Vanguard Group Inc, whose 10% stake in the company is worth $16,646,846,709.