We've been asking ourselves recently if the market has placed a fair valuation on Southern. Let's dive into some of the fundamental values of this Large-Cap Utilities company to determine if there might be an opportunity here for value-minded investors.
Southern's Valuation Is in Line With Its Sector Averages:
The Southern Company, through its subsidiaries, engages in the generation, transmission, and distribution of electricity. The company belongs to the Utilities sector, which has an average price to earnings (P/E) ratio of 21.16 and an average price to book (P/B) ratio of 2.36. In contrast, Southern has a trailing 12 month P/E ratio of 24.1 and a P/B ratio of 3.02.
Southern has moved 8.6% over the last year compared to 14.5% for the S&P 500 — a difference of -5.8%. Southern has a 52 week high of $96.44 and a 52 week low of $80.46.
The Company May Be Profitable, but Its Balance Sheet Is Highly Leveraged:
| 2019 | 2020 | 2021 | 2022 | 2023 | 2024 | |
|---|---|---|---|---|---|---|
| Revenue (M) | $22,596 | $20,375 | $23,113 | $29,279 | $25,253 | $26,724 |
| Operating Margins | 34% | 24% | 16% | 18% | 23% | 26% |
| Net Margins | 21% | 15% | 10% | 12% | 15% | 16% |
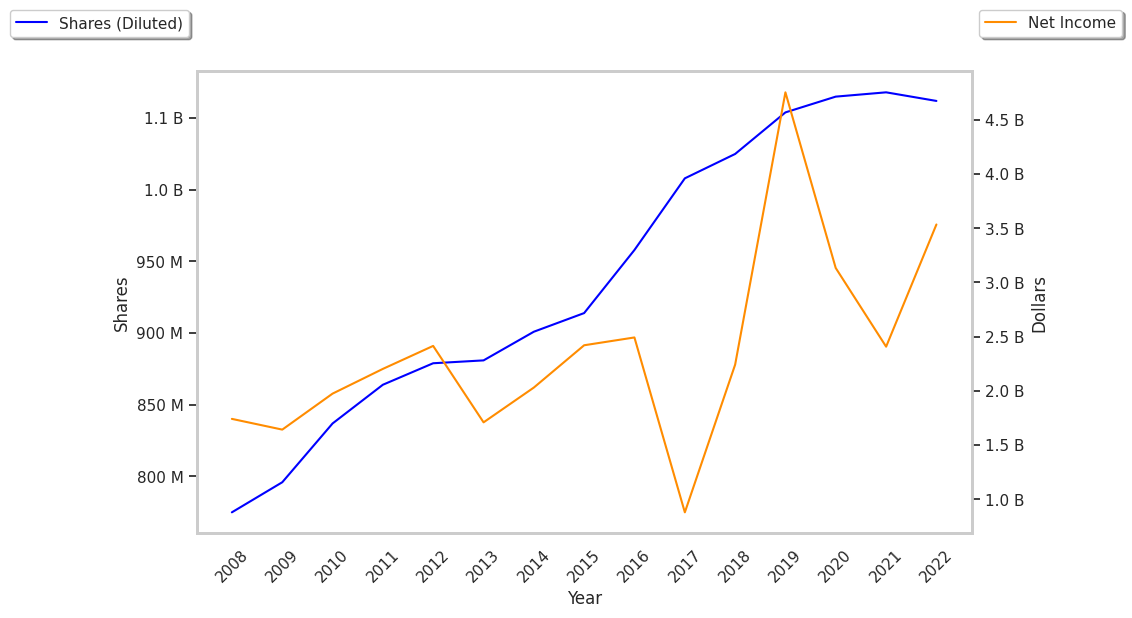
| Net Income (M) | $4,744 | $3,103 | $2,309 | $3,428 | $3,849 | $4,260 |
| Net Interest Expense (M) | $1,736 | $1,821 | $1,837 | $2,022 | $2,446 | $2,743 |
| Depreciation & Amort. (M) | $3,331 | $3,905 | $3,973 | $4,064 | $4,986 | $5,266 |
| Diluted Shares (M) | 1,054 | 1,065 | 1,068 | 1,081 | 1,098 | 1,102 |
| Earnings Per Share | $4.5 | $2.93 | $2.24 | $3.26 | $3.62 | $3.99 |
| EPS Growth | n/a | -34.89% | -23.55% | 45.54% | 11.04% | 10.22% |
| Avg. Price | $47.37 | $51.47 | $58.3 | $67.33 | $70.12 | $93.13 |
| P/E Ratio | 10.46 | 17.45 | 25.8 | 20.53 | 19.26 | 23.17 |
| Free Cash Flow (M) | -$1,774 | -$826 | -$1,417 | -$1,621 | -$1,542 | $833 |
| CAPEX (M) | $7,555 | $7,522 | $7,586 | $7,923 | $9,095 | $8,955 |
| EV / EBITDA | 8.2 | 11.42 | 14.64 | 13.03 | 12.55 | 13.22 |
| Total Debt (M) | $41,798 | $45,073 | $50,120 | $50,656 | $57,210 | $58,768 |
| Net Debt / EBITDA | 3.6 | 5.01 | 6.3 | 5.17 | 5.22 | 4.68 |
| Current Ratio | 0.78 | 0.71 | 0.82 | 0.66 | 0.77 | 0.67 |
Southern has declining EPS growth, not enough current assets to cover current liabilities because its current ratio is 0.67, and a highly leveraged balance sheet. On the other hand, the company benefits from growing revenues and increasing reinvestment in the business and strong operating margins with a stable trend. Furthermore, Southern has negative cash flows.