Today we're going to take a closer look at Large-Cap Finance company Aon, whose shares are currently trading at $372.96. We've been asking ourselves whether the company is under or over valued at today's prices... let's perform a brief value analysis to find out!
Aon's Valuation Is in Line With Its Sector Averages:
Aon plc, a professional services firm, provides a range of risk and human capital solutions worldwide. The company belongs to the Finance sector, which has an average price to earnings (P/E) ratio of 15.92 and an average price to book (P/B) ratio of 1.78. In contrast, Aon has a trailing 12 month P/E ratio of 31.4 and a P/B ratio of 10.26.
Aon has moved 6.7% over the last year compared to 16.2% for the S&P 500 — a difference of -9.5%. Aon has a 52 week high of $412.97 and a 52 week low of $323.73.
Generally Positive Cash Flows but Significant Leverage Levels:
| 2019 | 2020 | 2021 | 2022 | 2023 | 2024 | |
|---|---|---|---|---|---|---|
| Revenue (M) | $11,013 | $11,066 | $12,193 | $12,479 | $13,376 | $15,698 |
| Interest Income (M) | $307 | $334 | $322 | $406 | $484 | $658 |
| Operating Margins | 20% | 25% | 17% | 28% | 28% | 24% |
| Net Margins | 14% | 18% | 10% | 21% | 19% | 17% |
| Net Income (M) | $1,573 | $2,018 | $1,255 | $2,589 | $2,564 | $2,654 |
| Depreciation & Amort. (M) | $172 | $167 | $179 | $151 | $167 | $183 |
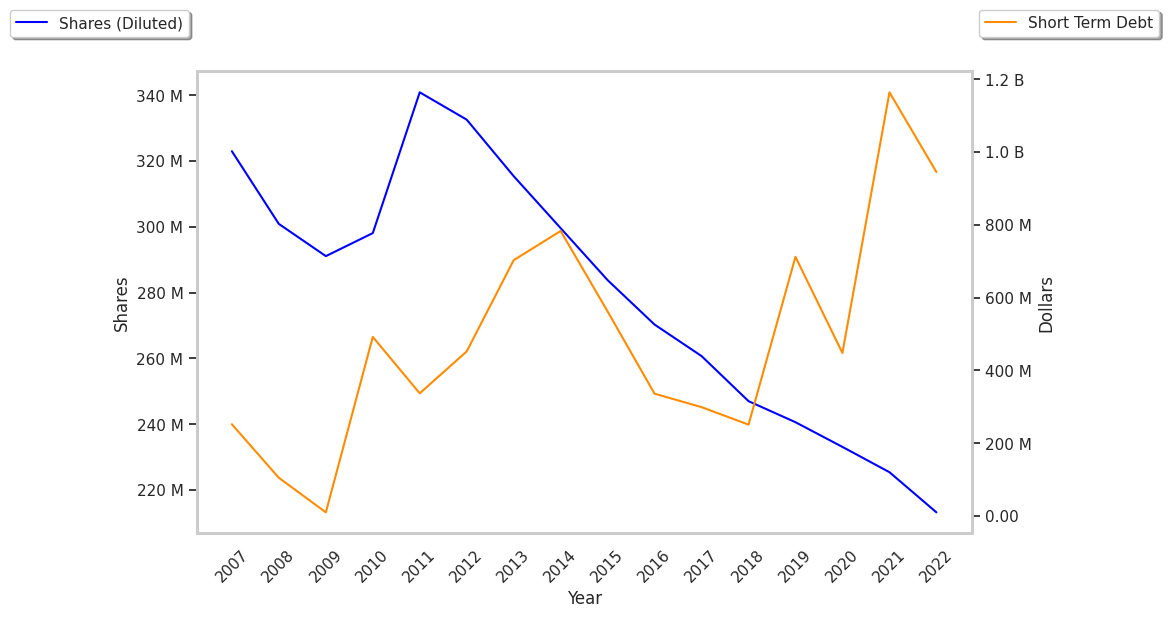
| Diluted Shares (M) | 241 | 233 | 226 | 213 | 205 | 212 |
| Earnings Per Share | $6.37 | $8.45 | $5.55 | $12.14 | $12.51 | $12.49 |
| EPS Growth | n/a | 32.65% | -34.32% | 118.74% | 3.05% | -0.16% |
| Avg. Price | $177.99 | $194.13 | $255.07 | $286.02 | $291.02 | $371.96 |
| P/E Ratio | 27.72 | 22.87 | 45.63 | 23.39 | 23.1 | 29.64 |
| Free Cash Flow (M) | $1,610 | $2,642 | $2,045 | $3,023 | $3,183 | $2,817 |
| CAPEX (M) | $225 | $141 | $137 | $196 | $252 | $218 |
| EV / EBITDA | 21.35 | 17.72 | 29.82 | 18.91 | 18.05 | 22.51 |
| Total Debt (M) | $8,051 | $8,177 | $10,556 | $11,715 | $12,403 | $17,767 |
| Net Debt / EBITDA | 3.1 | 2.47 | 4.41 | 2.89 | 2.94 | 4.15 |
| Current Ratio | 1.06 | 1.07 | 1.0 | 1.02 | 1.0 | 1.02 |
Aon has strong operating margins with a stable trend and generally positive cash flows. Additionally, the company's financial statements display growing revenues and a flat capital expenditure trend and a strong EPS growth trend. Furthermore, Aon has just enough current assets to cover current liabilities, as shown by its current ratio of 1.02 and significant leverage levels.


