Texas Instruments logged a 1.0% change during today's morning session, and is now trading at a price of $189.11 per share.
Texas Instruments returned losses of -5.1% last year, with its stock price reaching a high of $221.69 and a low of $139.95. Over the same period, the stock underperformed the S&P 500 index by -25.4%. AThe company's 50-day average price was $201.05. Texas Instruments Incorporated designs, manufactures, and sells semiconductors to electronics designers and manufacturers in the United States, China, rest of Asia, Europe, Middle East, Africa, Japan, and internationally. Based in Dallas, TX, the Large-Cap Technology company has 34,000 full time employees. Texas Instruments has offered a 2.9% dividend yield over the last 12 months.
Wider Gross Margins Than the Industry Average of 42.19%:
| 2019 | 2020 | 2021 | 2022 | 2023 | 2024 | |
|---|---|---|---|---|---|---|
| Revenue (M) | $14,383 | $14,461 | $18,344 | $20,028 | $17,519 | $15,641 |
| Gross Margins | 64% | 64% | 67% | 69% | 63% | 57% |
| Net Margins | 35% | 39% | 42% | 44% | 37% | 31% |
| Net Income (M) | $5,017 | $5,595 | $7,769 | $8,749 | $6,510 | $4,799 |
| Net Interest Expense (M) | $170 | $190 | $184 | $214 | $353 | $508 |
| Depreciation & Amort. (M) | $708 | $733 | $755 | $925 | $1,175 | $1,508 |
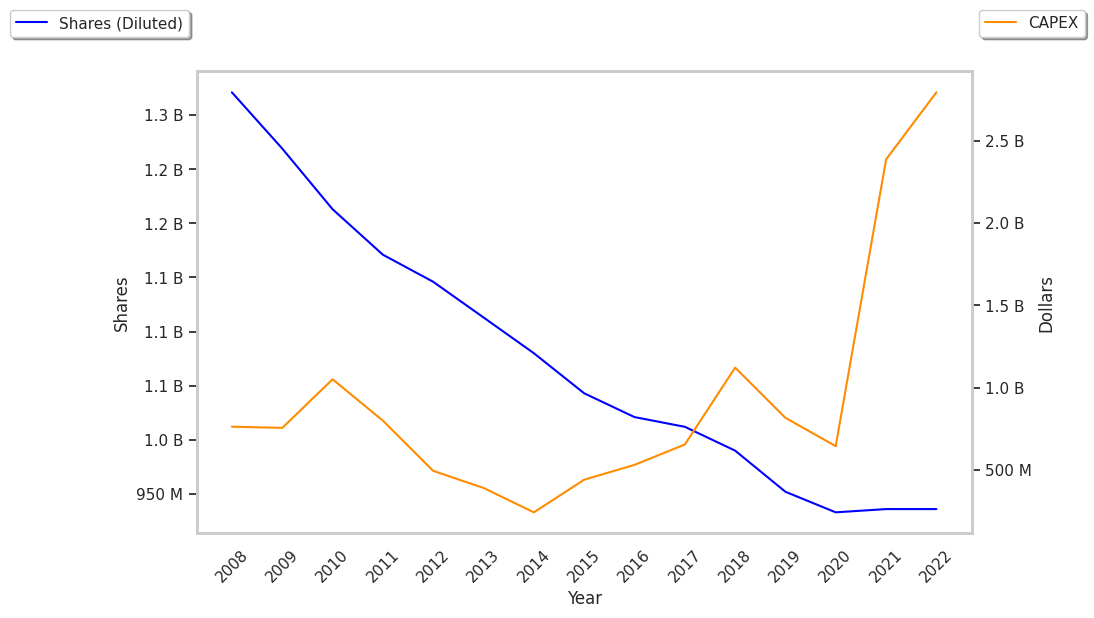
| Diluted Shares (M) | 952 | 933 | 936 | 926 | 916 | 919 |
| Earnings Per Share | $5.24 | $5.97 | $8.26 | $9.41 | $7.07 | $5.2 |
| EPS Growth | n/a | 13.93% | 38.36% | 13.92% | -24.87% | -26.45% |
| Avg. Price | $103.98 | $122.33 | $176.63 | $165.7 | $170.46 | $187.29 |
| P/E Ratio | 19.51 | 20.22 | 21.08 | 17.42 | 23.91 | 35.74 |
| Free Cash Flow (M) | $5,802 | $5,490 | $6,294 | $5,923 | $1,349 | $1,498 |
| CAPEX (M) | $847 | $649 | $2,462 | $2,797 | $5,071 | $4,820 |
| EV / EBITDA | 15.78 | 17.88 | 17.1 | 14.39 | 19.2 | 26.02 |
| Total Debt (M) | $6,303 | $7,348 | $8,241 | $9,235 | $11,822 | $14,346 |
| Net Debt / EBITDA | 0.6 | 0.64 | 0.37 | 0.56 | 1.04 | 1.6 |
| Current Ratio | 4.13 | 4.28 | 5.33 | 4.7 | 4.55 | 4.12 |
Texas Instruments has an excellent current ratio of 4.12 and slight revenue growth and increasing reinvestment in the business. Additionally, the company's financial statements display wider gross margins than its peer group and healthy leverage levels. However, the firm has positive cash flows. Finally, we note that Texas Instruments has flat EPS growth.
Texas Instruments's Valuation Is in Line With Its Sector Averages:
Texas Instruments has a trailing twelve month P/E ratio of 36.8, compared to an average of 30.44 for the Technology sector. Based on its EPS guidance of $5.88, the company has a forward P/E ratio of 34.2. The 1.7% compound average growth rate of Texas Instruments's historical and projected earnings per share yields a PEG ratio of 22.14. This suggests that these shares are overvalued. Furthermore, Texas Instruments is likely overvalued compared to the book value of its equity, since its P/B ratio of 10.48 is higher than the sector average of 4.19. The company's shares are currently trading 307.7% below their Graham number. Ultimately, Texas Instruments's strong cash flows, decent earnings multiple, and healthy debt levels factor towards it being fairly valued, its elevated P/B ratio notwithstanding.
There's an Analyst Consensus of Some Upside Potential for Texas Instruments:
The 33 analysts following Texas Instruments have set target prices ranging from $125.0 to $260.0 per share, for an average of $205.42 with a buy rating. The company is trading -7.9% away from its average target price, indicating that there is an analyst consensus of some upside potential.
Texas Instruments has an average amount of shares sold short because 2.0% of the company's shares are sold short. Institutions own 91.1% of the company's shares, and the insider ownership rate stands at 0.21%, suggesting a small amount of insider investors. The largest shareholder is Vanguard Group Inc, whose 10% stake in the company is worth $18,050,042,743.