Ameriprise Financial shares fell by -4.4% during the day's morning session, and are now trading at a price of $489.28. Is it time to buy the dip? To better answer that question, it's essential to check if the market is valuing the company's shares fairly in terms of its earnings and equity levels.
a Very Low P/E Ratio but Its Shares Are Expensive:
Ameriprise Financial, Inc., together with its subsidiaries, operates as a diversified financial services company in the United States and internationally. The company belongs to the Finance sector, which has an average price to earnings (P/E) ratio of 15.92 and an average price to book (P/B) ratio of 1.78. In contrast, Ameriprise Financial has a trailing 12 month P/E ratio of 15.2 and a P/B ratio of 7.59.
Ameriprise Financial has moved 12.1% over the last year compared to 18.5% for the S&P 500 — a difference of -6.3%. Ameriprise Financial has a 52 week high of $582.05 and a 52 week low of $396.14.
Growing Revenues and Good EPS Growth:
| 2019 | 2020 | 2021 | 2022 | 2023 | 2024 | |
|---|---|---|---|---|---|---|
| Revenue (M) | $13,103 | $11,958 | $13,389 | $14,334 | $16,096 | $17,926 |
| Interest Income (M) | $214 | $162 | $191 | $198 | $324 | $329 |
| Operating Margins | 17% | 15% | 31% | 27% | 20% | 24% |
| Net Margins | 14% | 13% | 26% | 22% | 16% | 19% |
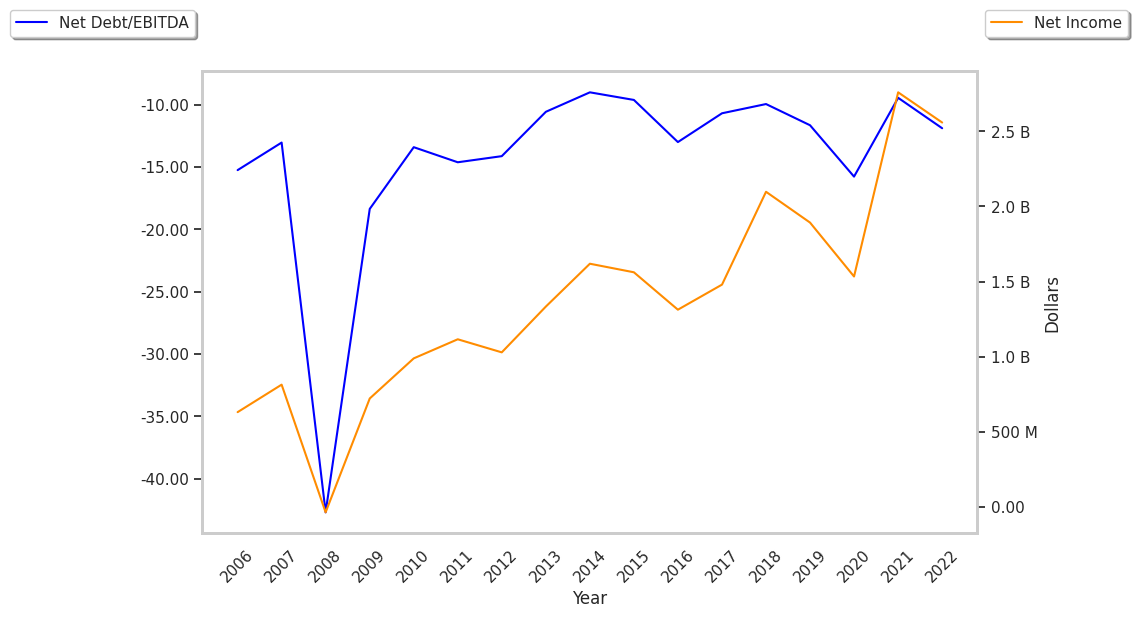
| Net Income (M) | $1,893 | $1,534 | $3,417 | $3,149 | $2,556 | $3,401 |
| Depreciation & Amort. (M) | $183 | $207 | $98 | -$40 | -$154 | $142 |
| Diluted Shares (M) | 131 | 123 | 120 | 111 | 106 | 103 |
| Earnings Per Share | $13.92 | $12.2 | $28.48 | $27.7 | $23.71 | $33.05 |
| EPS Growth | n/a | -12.36% | 133.44% | -2.74% | -14.4% | 39.39% |
| Avg. Price | $130.22 | $144.45 | $248.8 | $277.44 | $379.83 | $489.28 |
| P/E Ratio | 9.22 | 11.66 | 8.54 | 9.81 | 15.71 | 14.53 |
| Free Cash Flow (M) | $2,198 | $4,476 | $3,205 | $4,225 | $4,501 | $6,419 |
| CAPEX (M) | $143 | $147 | $120 | $182 | $184 | $176 |
| EV / EBITDA | 6.44 | 6.36 | 5.62 | 6.58 | 10.23 | 9.53 |
| Total Debt (M) | $1,628 | $1,913 | $2,164 | $2,363 | $2,155 | $2,429 |
| Net Debt / EBITDA | -0.86 | -2.37 | -1.16 | -1.16 | -1.57 | -1.6 |
Ameriprise Financial benefits from growing revenues and increasing reinvestment in the business, generally positive cash flows, and low leverage levels. The company's financial statements show decent operating margins with a positive growth rate and a strong EPS growth trend.