We've been asking ourselves recently if the market has placed a fair valuation on Dominion Energy. Let's dive into some of the fundamental values of this Large-Cap Utilities company to determine if there might be an opportunity here for value-minded investors.
a Very Low P/E Ratio but Priced Beyond Its Margin of Safety:
Dominion Energy, Inc. provides regulated electricity and natural gas services in the United States. The company belongs to the Utilities sector, which has an average price to earnings (P/E) ratio of 21.16 and an average price to book (P/B) ratio of 2.36. In contrast, Dominion Energy has a trailing 12 month P/E ratio of 19.3 and a P/B ratio of 1.89.
Dominion Energy has moved 1.4% over the last year compared to 18.5% for the S&P 500 — a difference of -17.0%. Dominion Energy has a 52 week high of $62.46 and a 52 week low of $48.07.
EPS Trend Sustained Primarily by Reducing the Number of Shares Outstanding:
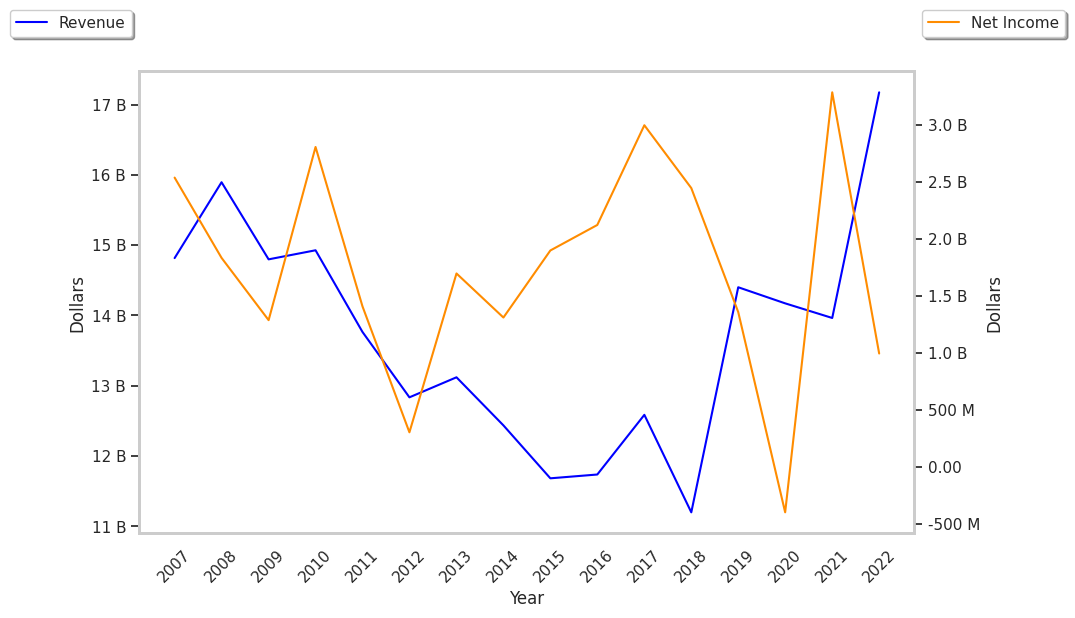
| 2019 | 2020 | 2021 | 2022 | 2023 | 2024 | |
|---|---|---|---|---|---|---|
| Revenue (M) | $14,401 | $11,919 | $11,419 | $13,938 | $14,393 | $14,459 |
| Operating Margins | 11% | 12% | 17% | 10% | 24% | 22% |
| Net Margins | 9% | -3% | 30% | 9% | 14% | 15% |
| Net Income (M) | $1,358 | -$401 | $3,399 | $1,191 | $2,031 | $2,124 |
| Net Interest Expense (M) | $1,486 | $1,339 | $1,255 | $1,002 | $1,674 | $1,887 |
| Depreciation & Amort. (M) | $2,283 | $1,991 | $2,117 | $2,442 | $2,580 | $2,345 |
| Diluted Shares (M) | 8,089 | 831 | 808 | 825 | 836 | 839 |
| Earnings Per Share | $1.62 | -$0.57 | $4.12 | $1.33 | $2.33 | $2.44 |
| EPS Growth | n/a | -135.19% | 822.81% | -67.72% | 75.19% | 4.72% |
| Avg. Price | $65.59 | $71.14 | $69.64 | $77.14 | $47.0 | $58.19 |
| P/E Ratio | 39.51 | -127.04 | 16.9 | 58.0 | 20.17 | 23.85 |
| Free Cash Flow (M) | $224 | $5,227 | $4,037 | $3,700 | $6,572 | -$4,479 |
| EV / EBITDA | 34.96 | 27.55 | 22.0 | 25.19 | 12.14 | 15.86 |
| Total Debt (M) | $29,060 | $34,002 | $34,592 | $35,525 | $33,703 | $40,270 |
| Net Debt / EBITDA | 7.56 | 9.97 | 8.35 | 9.1 | 5.59 | 7.15 |
| Current Ratio | 0.61 | 0.64 | 0.84 | 0.73 | 1.04 | 0.71 |
Dominion Energy's financial statements include several red flags such as EPS growth achieved by reducing the number of outstanding shares, positive cash flows, and not enough current assets to cover current liabilities because its current ratio is 0.71. Additionally, the firm has a highly leveraged balance sheet. On the other hand, the company benefits from slight revenue growth and increasing reinvestment in the business and decent operating margins with a positive growth rate.