Restaurant Brands International logged a -2.1% change during today's afternoon session, and is now trading at a price of $61.76 per share.
Restaurant Brands International returned losses of -6.9% last year, with its stock price reaching a high of $74.09 and a low of $58.71. Over the same period, the stock underperformed the S&P 500 index by -25.4%. AThe company's 50-day average price was $66.49. Restaurant Brands International Inc. operates as a quick-service restaurant company in Canada, the United States, and internationally. Based in Miami, FL, the Large-Cap Consumer Discretionary company has 37,600 full time employees. Restaurant Brands International has offered a 3.8% dividend yield over the last 12 months.
The Company May Be Profitable, but Its Balance Sheet Is Highly Leveraged:
| 2019 | 2020 | 2021 | 2022 | 2023 | 2024 | |
|---|---|---|---|---|---|---|
| Revenue (M) | $5,603 | $4,968 | $5,739 | $6,505 | $7,022 | $8,406 |
| Operating Margins | 36% | 28% | 33% | 28% | 28% | 28% |
| Net Margins | 20% | 15% | 22% | 23% | 24% | 17% |
| Net Income (M) | $1,111 | $750 | $1,253 | $1,482 | $1,718 | $1,445 |
| Net Interest Expense (M) | -$532 | -$508 | -$505 | -$533 | -$582 | -$577 |
| Depreciation & Amort. (M) | $185 | $189 | $201 | $190 | $191 | $186 |
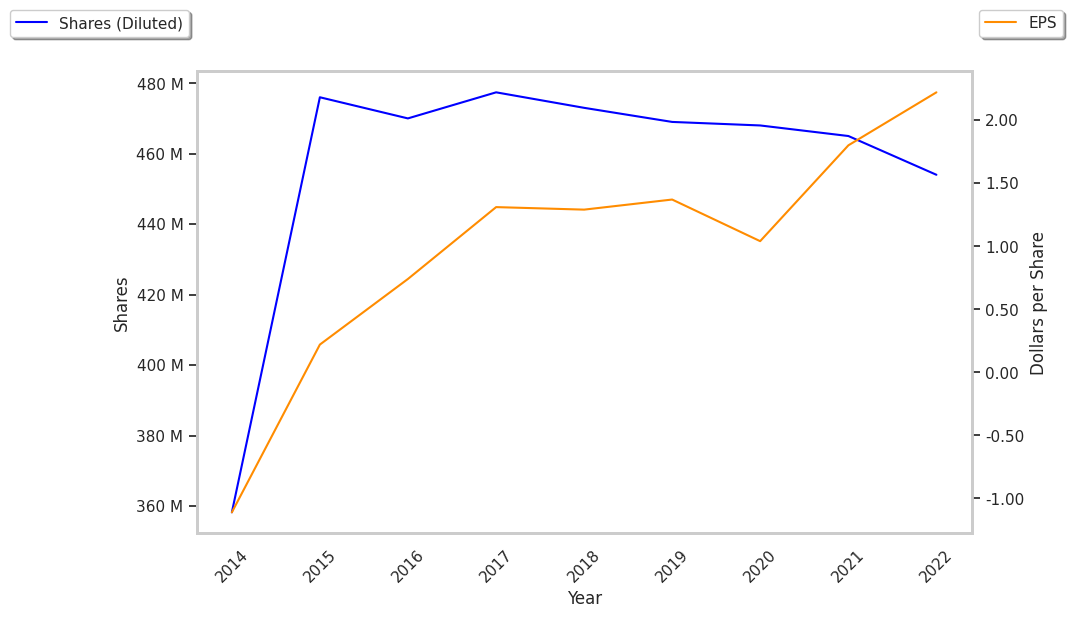
| Diluted Shares (M) | 469 | 468 | 464 | 455 | 456 | 454 |
| Earnings Per Share | $2.37 | $1.6 | $2.69 | $3.25 | $3.76 | $3.18 |
| EPS Growth | n/a | -32.49% | 68.12% | 20.82% | 15.69% | -15.43% |
| Avg. Price | $58.37 | $49.6 | $58.56 | $52.49 | $78.13 | $61.74 |
| P/E Ratio | 24.32 | 30.81 | 21.61 | 16.0 | 20.45 | 19.23 |
| Free Cash Flow (M) | $1,414 | $804 | $1,620 | $1,390 | $1,203 | $1,302 |
| CAPEX (M) | $62 | $117 | $106 | $100 | $120 | $201 |
| EV / EBITDA | 16.76 | 23.66 | 20.52 | 19.56 | 21.72 | 17.32 |
| Total Debt (M) | $23,592 | $24,873 | $25,894 | $25,773 | $25,775 | $27,097 |
| Net Debt / EBITDA | 10.06 | 14.47 | 11.93 | 11.78 | 10.99 | 9.89 |
| Current Ratio | 1.29 | 1.41 | 0.97 | 0.97 | 1.01 | 0.97 |
Restaurant Brands International has growing revenues and increasing reinvestment in the business, strong operating margins with a stable trend, and positive EPS growth. However, the firm suffers from not enough current assets to cover current liabilities because its current ratio is 0.97 and a highly leveraged balance sheet. Finally, we note that Restaurant Brands International has positive cash flows.
an Improvement in Earnings Next Year but Priced at a Premium:
Restaurant Brands International has a trailing twelve month P/E ratio of 25.1, compared to an average of 20.93 for the Consumer Discretionary sector. Based on its EPS guidance of $5.36, the company has a forward P/E ratio of 12.4. The 12.4% compound average growth rate of Restaurant Brands International's historical and projected earnings per share yields a PEG ratio of 2.03. This suggests that these shares are overvalued. Furthermore, Restaurant Brands International is likely overvalued compared to the book value of its equity, since its P/B ratio of 6.1 is higher than the sector average of 2.93. The company's shares are currently trading 179.0% below their Graham number. Ultimately, Restaurant Brands International's strong cash flows, decent earnings multiple, and healthy debt levels factor towards it being fairly valued, its elevated P/B ratio notwithstanding.
Restaurant Brands International Has an Average Rating of Buy:
The 28 analysts following Restaurant Brands International have set target prices ranging from $60.0 to $93.0 per share, for an average of $76.32 with a buy rating. The company is trading -19.1% away from its average target price, indicating that there is an analyst consensus of some upside potential.
Restaurant Brands International has an average amount of shares sold short because 4.8% of the company's shares are sold short. Institutions own 90.5% of the company's shares, and the insider ownership rate stands at 1.64%, suggesting a large amount of insider shareholders. The largest shareholder is Capital World Investors, whose 13% stake in the company is worth $2,656,300,801.