A strong performer from today's morning trading session is Morgan Stanley, whose shares rose 1.1% to $153.97 per share. For those of you thinking about investing in the stock, here is a brief value analysis of the stock using the company's basic fundamental ratios.
Morgan Stanley's Valuation Is in Line With Its Sector Averages:
Morgan Stanley, a financial holding company, provides various financial products and services to governments, financial institutions, and individuals in the Americas, Asia, Europe, Middle East, and Africa. The company belongs to the Finance sector, which has an average price to earnings (P/E) ratio of 15.92 and an average price to book (P/B) ratio of 1.78. In contrast, Morgan Stanley has a trailing 12 month P/E ratio of 17.4 and a P/B ratio of 2.5.
Morgan Stanley has moved 56.9% over the last year compared to 17.3% for the S&P 500 — a difference of 39.6%. Morgan Stanley has a 52 week high of $154.05 and a 52 week low of $94.09.
Increasing Revenues but Narrowing Margins:
| 2019 | 2020 | 2021 | 2022 | 2023 | 2024 | |
|---|---|---|---|---|---|---|
| Revenue (M) | $17,098 | $10,162 | $9,411 | $21,595 | $45,849 | $54,135 |
| Interest Income (M) | $4,694 | $6,313 | $8,045 | $9,327 | $8,230 | $8,611 |
| Net Income (M) | $9,042 | $10,996 | $15,034 | $11,029 | $9,087 | $13,390 |
| Depreciation & Amort. (M) | $2,643 | $3,769 | $4,216 | $3,998 | $4,256 | $5,161 |
| Diluted Shares (M) | 1,640 | 1,624 | 1,814 | 1,713 | 1,646 | 1,611 |
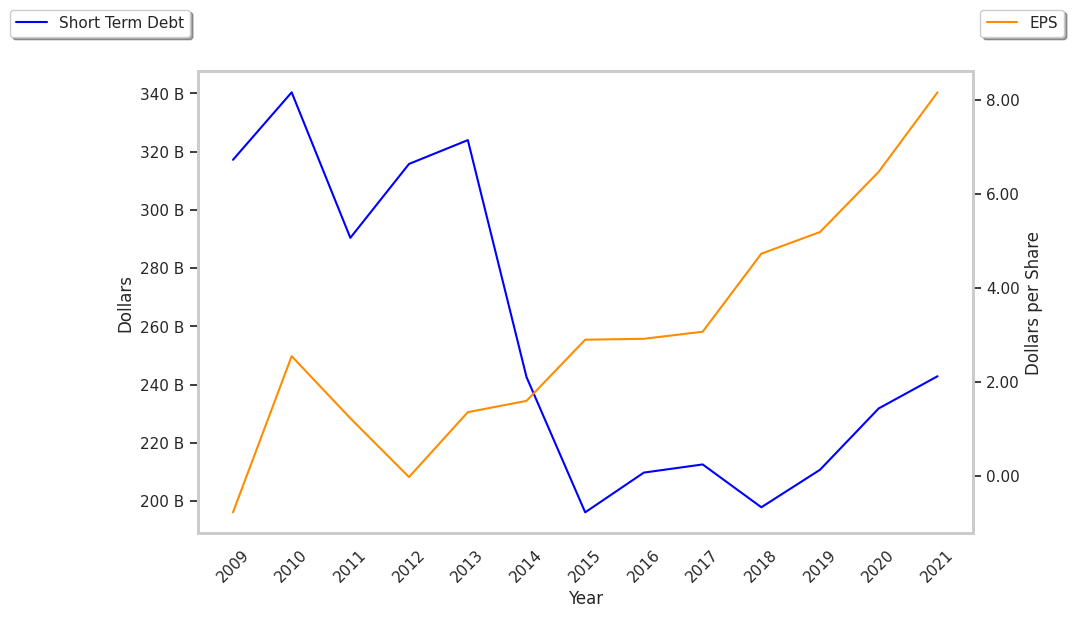
| Earnings Per Share | $5.19 | $6.46 | $8.03 | $6.15 | $5.18 | $7.95 |
| EPS Growth | n/a | 24.47% | 24.3% | -23.41% | -15.77% | 53.47% |
| Avg. Price | $39.37 | $45.19 | $85.09 | $85.06 | $93.25 | $152.22 |
| P/E Ratio | 7.48 | 6.9 | 10.43 | 13.65 | 17.8 | 18.93 |
| Free Cash Flow (M) | $38,947 | -$26,675 | $31,663 | -$9,475 | -$36,948 | -$2,100 |
| CAPEX (M) | $1,826 | $1,444 | $2,308 | $3,078 | $3,412 | $3,462 |
| EV / EBITDA | 18.15 | 9.9 | 10.63 | 14.22 | 20.42 | 18.8 |
| Total Debt (M) | $190,060 | $213,388 | $227,363 | $233,867 | $260,544 | $284,307 |
| Net Debt / EBITDA | 13.32 | 5.92 | 4.17 | 5.85 | 10.66 | 7.86 |