It's been a great afternoon session for AbbVie investors, who saw their shares rise 4.3% to a price of $220.78 per share. At these higher prices, is the company still fairly valued? If you are thinking about investing, make sure to check the company's fundamentals before making a decision.
AbbVie's Valuation Is in Line With Its Sector Averages:
AbbVie Inc., a research-based biopharmaceutical company, engages in the research and development, manufacture, commercialization, and sale of medicines and therapies worldwide. The company belongs to the Health Care sector, which has an average price to earnings (P/E) ratio of 22.94. In contrast, AbbVie has a trailing 12 month P/E ratio of 105.1 based on its earnings per share of $2.1.
AbbVie has moved 9.1% over the last year compared to 16.7% for the S&P 500 -- a difference of -7.7%. AbbVie has a 52 week high of $221.76 and a 52 week low of $163.81.
Increasing Revenues but Narrowing Margins:
| 2019 | 2020 | 2021 | 2022 | 2023 | 2024 | |
|---|---|---|---|---|---|---|
| Revenue (M) | $33,266 | $45,804 | $56,197 | $58,054 | $54,318 | $56,334 |
| Operating Margins | 39% | 25% | 32% | 31% | 23% | 16% |
| Net Margins | 24% | 10% | 21% | 20% | 9% | 8% |
| Net Income (M) | $7,882 | $4,616 | $11,542 | $11,836 | $4,863 | $4,278 |
| Net Interest Expense (M) | -$1,509 | -$2,280 | -$2,384 | -$2,044 | -$1,684 | -$2,160 |
| Depreciation & Amort. (M) | $464 | $666 | $803 | $778 | $752 | $764 |
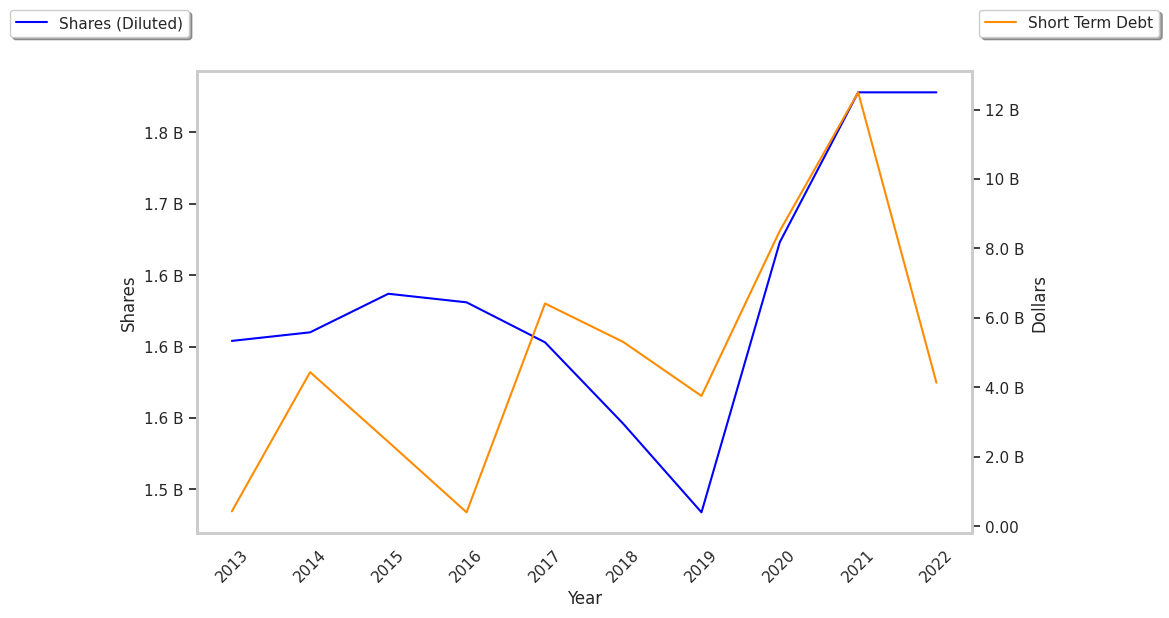
| Diluted Shares (M) | 1,484 | 1,673 | 1,777 | 1,778 | 1,773 | 1,773 |
| Earnings Per Share | $5.28 | $2.72 | $6.45 | $6.63 | $2.72 | $2.39 |
| EPS Growth | n/a | -48.48% | 137.13% | 2.79% | -58.97% | -12.13% |
| Avg. Price | $65.1 | $80.3 | $104.86 | $142.88 | $154.97 | $221.14 |
| P/E Ratio | 12.28 | 29.41 | 16.18 | 21.49 | 56.77 | 92.14 |
| Free Cash Flow (M) | $12,772 | $16,790 | $21,990 | $24,248 | $22,062 | $17,832 |
| CAPEX (M) | $552 | $798 | $787 | $695 | $777 | $974 |
| EV / EBITDA | 9.13 | 16.32 | 13.46 | 16.24 | 23.75 | 46.33 |
| Total Debt (M) | $66,728 | $86,022 | $76,670 | $63,270 | $59,385 | $73,645 |
| Net Debt / EBITDA | 1.99 | 6.45 | 3.57 | 2.86 | 3.45 | 6.88 |
| Current Ratio | 3.18 | 0.84 | 0.79 | 0.96 | 0.87 | 0.66 |
AbbVie has declining EPS growth, not enough current assets to cover current liabilities because its current ratio is 0.66, and a highly leveraged balance sheet. On the other hand, the company benefits from growing revenues and increasing reinvestment in the business and generally positive cash flows. Furthermore, AbbVie has decent operating margins with a negative growth trend.