Now trading at a price of $32.48, Carnival has moved 3.6% so far today.
Carnival returned gains of 85.3% last year, with its stock price reaching a high of $32.8 and a low of $15.07. Over the same period, the stock outperformed the S&P 500 index by 68.6%. More recently, the company's 50-day average price was $30.03. Carnival Corporation & plc, a cruise company, provides leisure travel services in North America, Australia, Europe, and internationally. Based in Miami, FL, the Large-Cap Consumer Discretionary company has 115,000 full time employees. Carnival has not offered a dividend during the last year.
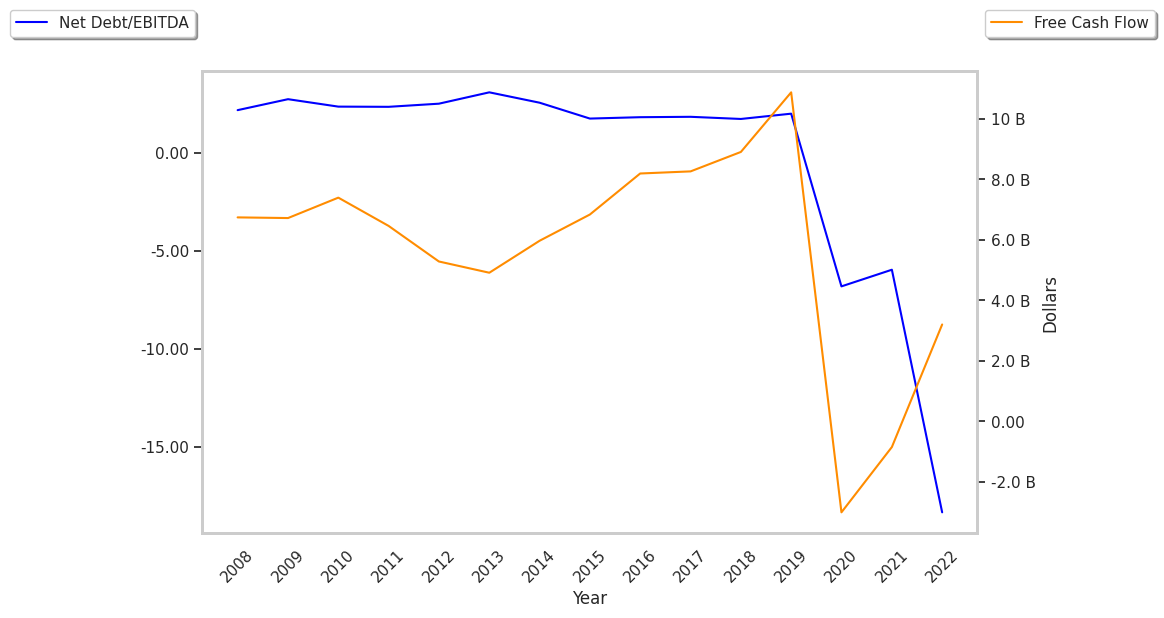
The Company Has a Highly Leveraged Balance Sheet and a Declining EPS Growth Trend:
| 2019 | 2020 | 2021 | 2022 | 2023 | 2024 | |
|---|---|---|---|---|---|---|
| Revenue (M) | $20,825 | $5,595 | $1,908 | $12,168 | $21,593 | $25,021 |
| Operating Margins | 16% | -158% | -372% | -36% | 9% | 14% |
| Net Margins | 14% | -183% | -498% | -50% | 0% | 8% |
| Net Income (M) | $2,990 | -$10,236 | -$9,501 | -$6,093 | -$74 | $1,916 |
| Net Interest Expense (M) | $206 | $895 | $1,601 | $1,609 | $2,066 | $1,600 |
| Depreciation & Amort. (M) | $2,160 | $2,241 | $2,233 | $2,275 | $2,370 | $2,557 |
| Diluted Shares (M) | 692 | 775 | 1,123 | 1,180 | 1,262 | 1,398 |
| Earnings Per Share | $4.32 | -$13.2 | -$8.46 | -$5.16 | -$0.06 | $1.44 |
| EPS Growth | n/a | -405.56% | 35.91% | 39.01% | 98.84% | 2500.0% |
| Avg. Price | $47.87 | $20.79 | $24.05 | $17.12 | $18.54 | $32.52 |
| P/E Ratio | 11.03 | -1.57 | -2.84 | -3.32 | -309.0 | 21.68 |
| Free Cash Flow (M) | $46 | -$9,921 | -$7,716 | -$6,610 | $997 | $1,297 |
| CAPEX (M) | $5,429 | $3,620 | $3,607 | $4,940 | $3,284 | $4,626 |
| EV / EBITDA | 8.31 | -4.46 | -4624.31 | -25.68 | 12.74 | 11.58 |
| Total Debt (M) | $11,271 | $24,274 | $33,891 | $38,008 | $33,428 | $29,751 |
| Net Debt / EBITDA | 1.98 | -2.23 | -5.14 | -16.15 | 7.17 | 4.66 |
| Current Ratio | 0.23 | 1.22 | 0.97 | 0.71 | 0.46 | 0.29 |
Carnival's financial statements include several red flags such as weak operating margins with a stable trend, declining EPS growth, and not enough current assets to cover current liabilities because its current ratio is 0.29. Additionally, the firm has a highly leveraged balance sheet. On the other hand, the company has growing revenues and a flat capital expenditure trend working in its favor. Furthermore, Carnival has negative cash flows.
a Very Low P/E Ratio but Trading Above Its Fair Price:
Carnival has a trailing twelve month P/E ratio of 15.7, compared to an average of 20.93 for the Consumer Discretionary sector. Based on its EPS guidance of $1.72, the company has a forward P/E ratio of 17.5. The -12.3% compound average growth rate of Carnival's historical and projected earnings per share yields a PEG ratio of -1.28. This indicates that its shares are overvalued.Furthermore, Carnival is likely overvalued compared to the book value of its equity, since its P/B ratio of 4.26 is higher than the sector average of 2.93. The company's shares are currently trading 121.9% below their Graham number.
There's an Analyst Consensus of Some Upside Potential for Carnival:
The 22 analysts following Carnival have set target prices ranging from $24.0 to $43.0 per share, for an average of $33.09 with a buy rating. The company is trading -1.8% away from its average target price, indicating that there is an analyst consensus of some upside potential.
Carnival has an average amount of shares sold short because 4.9% of the company's shares are sold short. Institutions own 72.3% of the company's shares, and the insider ownership rate stands at 7.59%, suggesting a large amount of insider shareholders. The largest shareholder is Vanguard Group Inc, whose 11% stake in the company is worth $4,114,030,194.