Royal Caribbean Cruises logged a 2.7% change during today's afternoon session, and is now trading at a price of $350.86 per share.
Royal Caribbean Cruises returned gains of 106.3% last year, with its stock price reaching a high of $366.5 and a low of $162.49. Over the same period, the stock outperformed the S&P 500 index by 89.5%. More recently, the company's 50-day average price was $335.57. Royal Caribbean Cruises Ltd. operates as a cruise company worldwide. Based in Miami, FL, the Large-Cap Consumer Discretionary company has 105,950 full time employees. Royal Caribbean Cruises has offered a 0.7% dividend yield over the last 12 months.
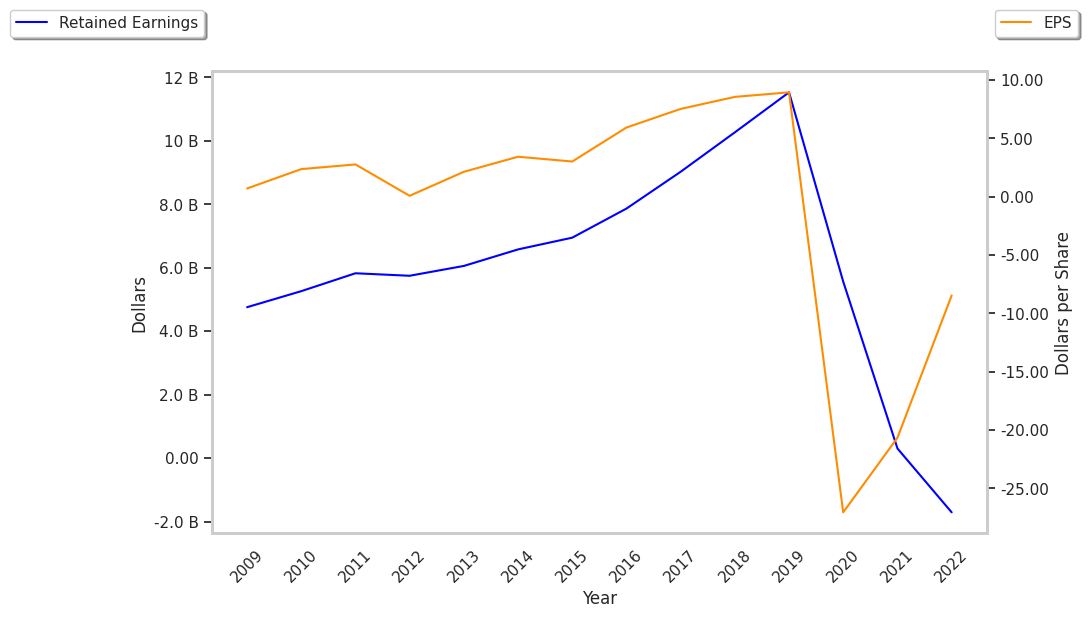
A Positive EPS Growth Rate at the Expense of a Highly Leveraged Balance Sheet:
| 2019 | 2020 | 2021 | 2022 | 2023 | 2024 | |
|---|---|---|---|---|---|---|
| Revenue (M) | $10,951 | $2,209 | $1,532 | $8,840 | $13,900 | $16,484 |
| Operating Margins | 19% | -208% | -252% | -9% | 21% | 25% |
| Net Margins | 17% | -262% | -343% | -24% | 12% | 17% |
| Net Income (M) | $1,879 | -$5,797 | -$5,260 | -$2,156 | $1,704 | $2,877 |
| Net Interest Expense (M) | $409 | $844 | $1,292 | $137 | -$1,402 | $1,210 |
| Depreciation & Amort. (M) | $1,246 | $1,279 | $1,293 | $1,407 | $1,455 | $1,600 |
| Diluted Shares (M) | 210 | 214 | 252 | 255 | 283 | 279 |
| Earnings Per Share | $8.95 | -$27.05 | -$20.89 | -$8.45 | $6.31 | $10.94 |
| EPS Growth | n/a | -402.23% | 22.77% | 59.55% | 174.67% | 73.38% |
| Avg. Price | $112.57 | $65.95 | $82.16 | $69.1 | $129.49 | $351.7 |
| P/E Ratio | 12.55 | -2.44 | -3.93 | -8.18 | 19.53 | 31.97 |
| Free Cash Flow (M) | $692 | -$5,697 | -$4,108 | -$2,229 | $580 | $1,997 |
| CAPEX (M) | $3,025 | $1,965 | $2,230 | $2,710 | $3,897 | $3,268 |
| EV / EBITDA | 10.32 | -8.86 | -14.71 | 60.96 | 12.47 | 19.27 |
| Total Debt (M) | $11,035 | $19,329 | $21,090 | $23,391 | $21,452 | $20,076 |
| Net Debt / EBITDA | 3.24 | -4.71 | -7.14 | 33.47 | 4.84 | 3.45 |
| Current Ratio | 0.15 | 0.95 | 0.49 | 0.37 | 0.19 | 0.17 |
Royal Caribbean Cruises Has Elevated P/B and P/E Ratios:
Royal Caribbean Cruises has a trailing twelve month P/E ratio of 24.9, compared to an average of 20.93 for the Consumer Discretionary sector. Based on its EPS guidance of $14.29, the company has a forward P/E ratio of 23.5. The 6.9% compound average growth rate of Royal Caribbean Cruises's historical and projected earnings per share yields a PEG ratio of 3.61. This suggests that these shares are overvalued. Furthermore, Royal Caribbean Cruises is likely overvalued compared to the book value of its equity, since its P/B ratio of 10.39 is higher than the sector average of 2.93. The company's shares are currently trading 329.5% below their Graham number. Overall, Royal Caribbean Cruises's lofty valuation in terms of earnings and assets is to some extent attenuated by its strong cash flow trend and reasonable levels of debt.
Royal Caribbean Cruises Has an Analyst Consensus of Some Upside Potential:
The 23 analysts following Royal Caribbean Cruises have set target prices ranging from $218.0 to $420.0 per share, for an average of $355.57 with a buy rating. The company is trading -1.3% away from its average target price, indicating that there is an analyst consensus of some upside potential.
Royal Caribbean Cruises has an average amount of shares sold short because 5.2% of the company's shares are sold short. Institutions own 91.0% of the company's shares, and the insider ownership rate stands at 0.25%, suggesting a small amount of insider investors. The largest shareholder is Capital International Investors, whose 12% stake in the company is worth $11,452,485,065.