Today we're going to take a closer look at Large-Cap Consumer Staples company Corteva, whose shares are currently trading at $72.74. We've been asking ourselves whether the company is under or over valued at today's prices... let's perform a brief value analysis to find out!
a Lower P/B Ratio Than Its Sector Average but Trading Above Its Fair Price:
Corteva, Inc. operates in the agriculture business. The company belongs to the Consumer Staples sector, which has an average price to earnings (P/E) ratio of 25.91 and an average price to book (P/B) ratio of 3.03. In contrast, Corteva has a trailing 12 month P/E ratio of 33.5 and a P/B ratio of 1.91.
Corteva has moved 28.9% over the last year compared to 17.1% for the S&P 500 — a difference of 11.8%. Corteva has a 52 week high of $77.41 and a 52 week low of $53.4.
Generally Positive Cash Flows but an Average Current Ratio:
| 2019 | 2020 | 2021 | 2022 | 2023 | 2024 | |
|---|---|---|---|---|---|---|
| Revenue (M) | $13,846 | $14,217 | $15,655 | $17,455 | $17,226 | $16,908 |
| Operating Margins | -2% | 5% | 15% | 8% | 6% | 8% |
| Net Margins | -7% | 5% | 11% | 7% | 4% | 5% |
| Net Income (M) | -$959 | $681 | $1,759 | $1,147 | $735 | $907 |
| Net Interest Expense (M) | $136 | $45 | $30 | $79 | $233 | $233 |
| Depreciation & Amort. (M) | $475 | $682 | $722 | $702 | $683 | $542 |
| Diluted Shares (M) | 750 | 751 | 742 | 724 | 712 | 696 |
| Earnings Per Share | -$1.28 | $0.91 | $2.37 | $1.58 | $1.03 | $1.3 |
| EPS Growth | n/a | 171.09% | 160.44% | -33.33% | -34.81% | 26.21% |
| Avg. Price | $26.24 | $28.37 | $43.88 | $53.84 | $47.92 | $72.99 |
| P/E Ratio | -20.5 | 31.18 | 18.36 | 33.86 | 46.08 | 55.72 |
| Free Cash Flow (M) | -$93 | $1,589 | $2,154 | $267 | $1,174 | $1,548 |
| CAPEX (M) | $1,163 | $475 | $573 | $605 | $595 | $597 |
| EV / EBITDA | 113.36 | 13.88 | 9.55 | 17.51 | 19.15 | 27.97 |
| Total Debt (M) | $122 | $1,105 | $1,117 | $1,307 | $2,489 | $2,703 |
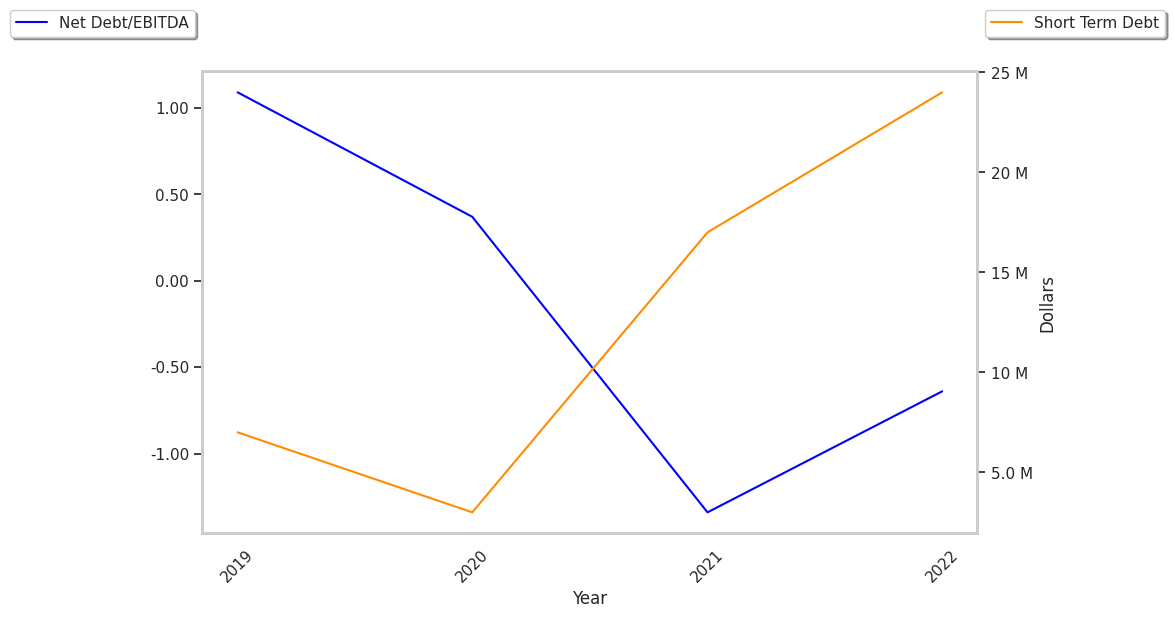
| Net Debt / EBITDA | -10.33 | -1.78 | -1.09 | -0.89 | -0.09 | -0.22 |
| Current Ratio | 1.64 | 1.73 | 1.63 | 1.56 | 1.56 | 1.45 |
Corteva has generally positive cash flows, a strong EPS growth trend, and healthy leverage levels. Furthermore, Corteva has growing revenues and decreasing reinvestment in the business, weak operating margins with a positive growth rate, and just enough current assets to cover current liabilities, as shown by its current ratio of 1.45.