Now trading at a price of $16.02, Sunrun has moved 0.1% so far today.
Sunrun returned losses of -16.7% last year, with its stock price reaching a high of $21.77 and a low of $5.38. Over the same period, the stock underperformed the S&P 500 index by -33.8%. AThe company's 50-day average price was $12.61. Sunrun Inc. designs, develops, installs, sells, owns, and maintains residential solar energy systems in the United States. Based in San Francisco, CA, the Mid-Cap Technology company has 11,058 full time employees. Sunrun has not offered a dividend during the last year.
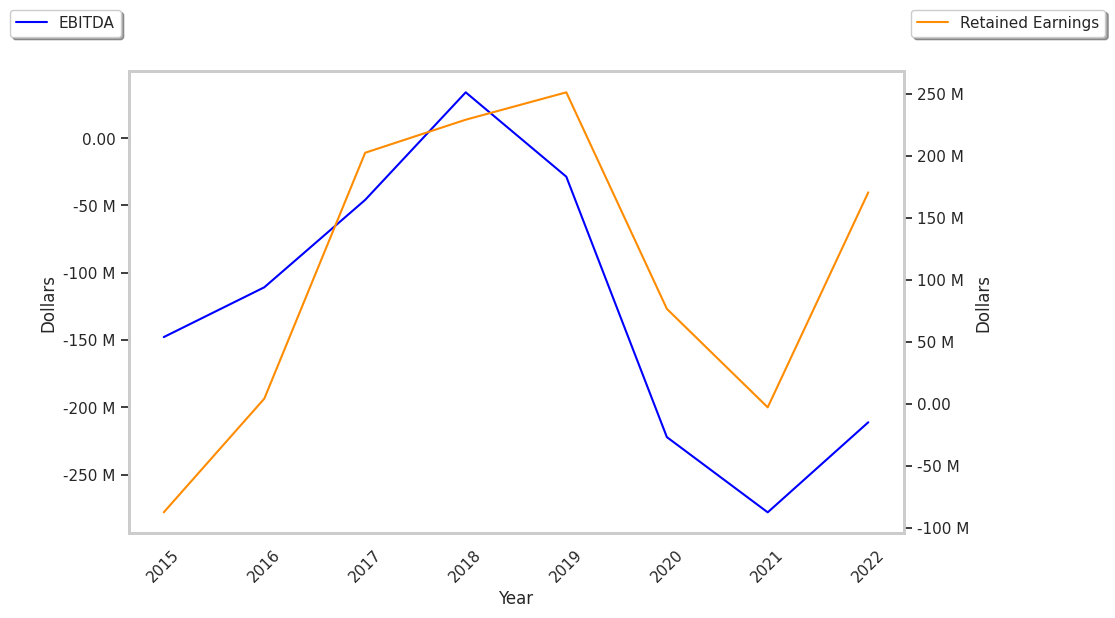
The Business Is Unprofitable and Its Balance Sheet Is Highly Leveraged:
| 2019 | 2020 | 2021 | 2022 | 2023 | 2024 | |
|---|---|---|---|---|---|---|
| Revenue (M) | $859 | $922 | $1,610 | $2,321 | $2,260 | $2,038 |
| Operating Margins | -25% | -50% | -41% | -28% | -88% | -181% |
| Net Margins | 3% | -19% | -5% | 7% | -71% | -140% |
| Net Income (M) | $26 | -$173 | -$79 | $173 | -$1,604 | -$2,846 |
| Net Interest Expense (M) | -$174 | -$231 | -$328 | -$446 | -$653 | -$848 |
| Depreciation & Amort. (M) | $187 | $243 | $388 | $451 | $532 | $585 |
| Diluted Shares (M) | 124 | 140 | 205 | 219 | 217 | 222 |
| Earnings Per Share | $0.21 | -$1.24 | -$0.39 | $0.8 | -$7.41 | -$12.81 |
| EPS Growth | n/a | -690.48% | 68.55% | 305.13% | -1026.25% | -72.87% |
| Avg. Price | $15.62 | $35.45 | $52.9 | $25.93 | $19.63 | $16.01 |
| P/E Ratio | 67.91 | -28.59 | -135.64 | 31.62 | -2.65 | -1.25 |
| Free Cash Flow (M) | -$230 | -$321 | -$826 | -$867 | -$842 | -$767 |
| CAPEX (M) | $25 | $3 | $9 | $18 | $21 | $1 |
| EV / EBITDA | -137.89 | -39.79 | -61.08 | -64.37 | -10.07 | -5.16 |
| Total Debt (M) | $2,255 | $4,796 | $6,503 | $8,399 | $10,672 | $12,901 |
| Current Ratio | 1.38 | 1.26 | 1.53 | 1.82 | 1.26 | 1.29 |
Sunrun has declining EPS growth, negative cash flows, and High Levels of Debt. On the other hand, the company has rapidly growing revenues and decreasing reinvestment in the business working in its favor. Furthermore, Sunrun has just enough current assets to cover current liabilities, as shown by its current ratio of 1.29.
Sunrun does not have a meaningful trailing P/E ratio since its earnings per share are negative. Its forward EPS guidance is negative too, at $-0.75. The average P/E ratio for the Technology sector is 30.44. On the other hand, the market is undervaluing Sunrun in terms of its equity because its P/B ratio is 1.26. In comparison, the sector average is 4.19. In conclusion, Sunrun's impressive cash flow trend, decent P/B ratio, and reasonable use of leverage demonstrate that the company may still be fairly valued — despite its elevated earnings multiple.
Sunrun Has an Average Rating of Buy:
The 19 analysts following Sunrun have set target prices ranging from $10.0 to $25.0 per share, for an average of $15.92 with a buy rating. The company is trading 0.6% away from its average target price, indicating that there is an analyst consensus of little upside potential.
Sunrun has an unusually large proportion of its shares sold short because 31.4% of the company's shares are sold short. Institutions own 105.1% of the company's shares, and the insider ownership rate stands at 3.28%, suggesting a decent amount of insider shareholders. The largest shareholder is Blackrock Inc., whose 16% stake in the company is worth $597,559,185.