We've been asking ourselves recently if the market has placed a fair valuation on Charter Communications. Let's dive into some of the fundamental values of this Large-Cap Telecommunications company to determine if there might be an opportunity here for value-minded investors.
Charter Communications Shares Are Expensive:
Charter Communications, Inc. operates as a broadband connectivity and cable operator company serving residential and commercial customers in the United States. The company belongs to the Telecommunications sector, which has an average price to earnings (P/E) ratio of 18.22 and an average price to book (P/B) ratio of 1.86. In contrast, Charter Communications has a trailing 12 month P/E ratio of 7.1 and a P/B ratio of 2.18.
Charter Communications has moved -23.2% over the last year compared to 17.4% for the S&P 500 — a difference of -40.6%. Charter Communications has a 52 week high of $437.06 and a 52 week low of $251.8.
Exceptional Profitability Overshadowed by Excessive Leverage:
| 2019 | 2020 | 2021 | 2022 | 2023 | 2024 | |
|---|---|---|---|---|---|---|
| Revenue (M) | $45,764 | $48,097 | $51,682 | $54,022 | $54,607 | $55,085 |
| Operating Margins | 14% | 17% | 20% | 22% | 23% | 24% |
| Net Margins | 4% | 7% | 9% | 9% | 8% | 9% |
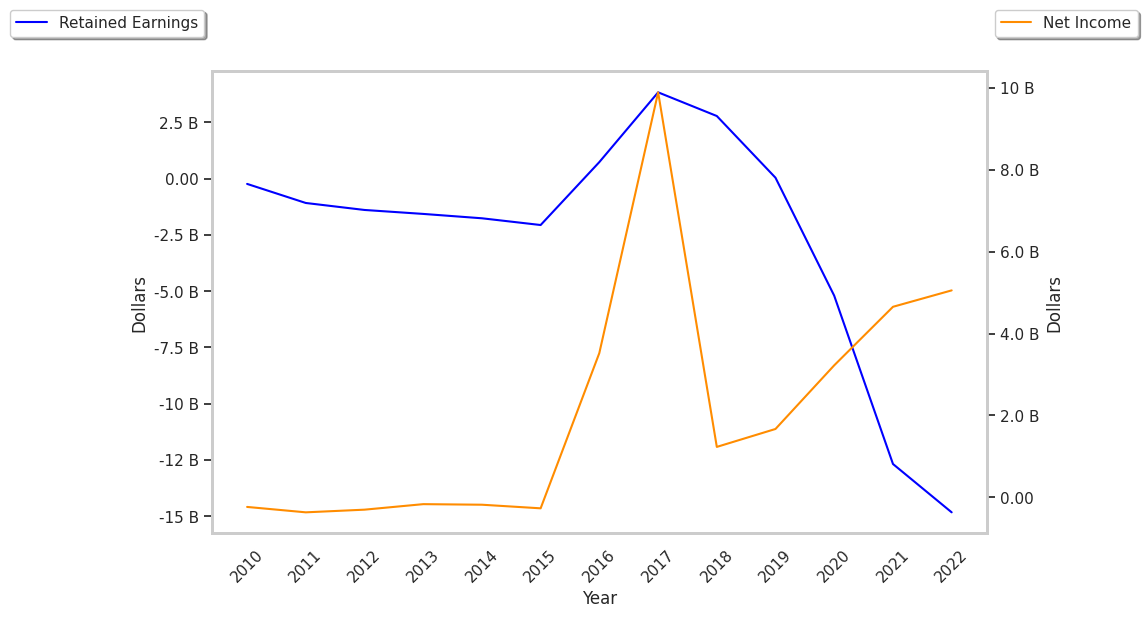
| Net Income (M) | $1,668 | $3,222 | $4,654 | $5,055 | $4,557 | $5,083 |
| Net Interest Expense (M) | -$3,797 | -$3,848 | -$4,037 | -$4,556 | -$5,188 | -$5,229 |
| Depreciation & Amort. (M) | $9,926 | $9,704 | $9,345 | $8,903 | $8,696 | $7,800 |
| Diluted Shares (M) | 218 | 212 | 193 | 164 | 152 | 145 |
| Earnings Per Share | $7.45 | $15.4 | $24.47 | $30.74 | $29.99 | $34.97 |
| EPS Growth | n/a | 106.71% | 58.9% | 25.62% | -2.44% | 16.61% |
| Avg. Price | $392.79 | $556.45 | $685.17 | $534.78 | $388.68 | $260.72 |
| P/E Ratio | 51.68 | 35.11 | 27.04 | 17.09 | 12.73 | 7.34 |
| Free Cash Flow (M) | $4,553 | $7,147 | $8,604 | $5,549 | $3,318 | $3,161 |
| CAPEX (M) | $7,195 | $7,415 | $7,635 | $9,376 | $11,115 | $11,269 |
| EV / EBITDA | 9.83 | 10.52 | 10.68 | 8.63 | 7.32 | 6.32 |
| Total Debt (M) | $82,578 | $83,760 | $94,558 | $99,113 | $99,777 | $95,732 |
| Net Debt / EBITDA | 4.81 | 4.57 | 4.73 | 4.72 | 4.66 | 4.55 |
| Current Ratio | 0.52 | 0.4 | 0.29 | 0.33 | 0.31 | 0.31 |
Charter Communications has growing revenues and increasing reinvestment in the business, strong operating margins with a positive growth rate, and exceptional EPS growth. However, Charter Communications has positive cash flows, not enough current assets to cover current liabilities because its current ratio is 0.31, and a highly leveraged balance sheet.