We've been asking ourselves recently if the market has placed a fair valuation on PayPal. Let's dive into some of the fundamental values of this Large-Cap Industrials company to determine if there might be an opportunity here for value-minded investors.
a Very Low P/E Ratio but Its Shares Are Expensive:
PayPal Holdings, Inc. operates a technology platform that enables digital payments for merchants and consumers worldwide. The company belongs to the Industrials sector, which has an average price to earnings (P/E) ratio of 24.03 and an average price to book (P/B) ratio of 2.89. In contrast, PayPal has a trailing 12 month P/E ratio of 14.7 and a P/B ratio of 3.26.
PayPal has moved -11.5% over the last year compared to 15.5% for the S&P 500 — a difference of -27.1%. PayPal has a 52 week high of $93.66 and a 52 week low of $55.85.
Strong Revenue Growth but an Average Current Ratio:
| 2019 | 2020 | 2021 | 2022 | 2023 | 2024 | |
|---|---|---|---|---|---|---|
| Revenue (M) | $17,772 | $21,454 | $25,371 | $27,518 | $29,771 | $31,797 |
| Operating Margins | 15% | 15% | 17% | 14% | 17% | 17% |
| Net Margins | 14% | 20% | 16% | 9% | 14% | 13% |
| Net Income (M) | $2,459 | $4,202 | $4,169 | $2,419 | $4,246 | $4,147 |
| Net Interest Expense (M) | $115 | $209 | $232 | $304 | $347 | $366 |
| Depreciation & Amort. (M) | $912 | $1,189 | $1,265 | $1,317 | $1,072 | $825 |
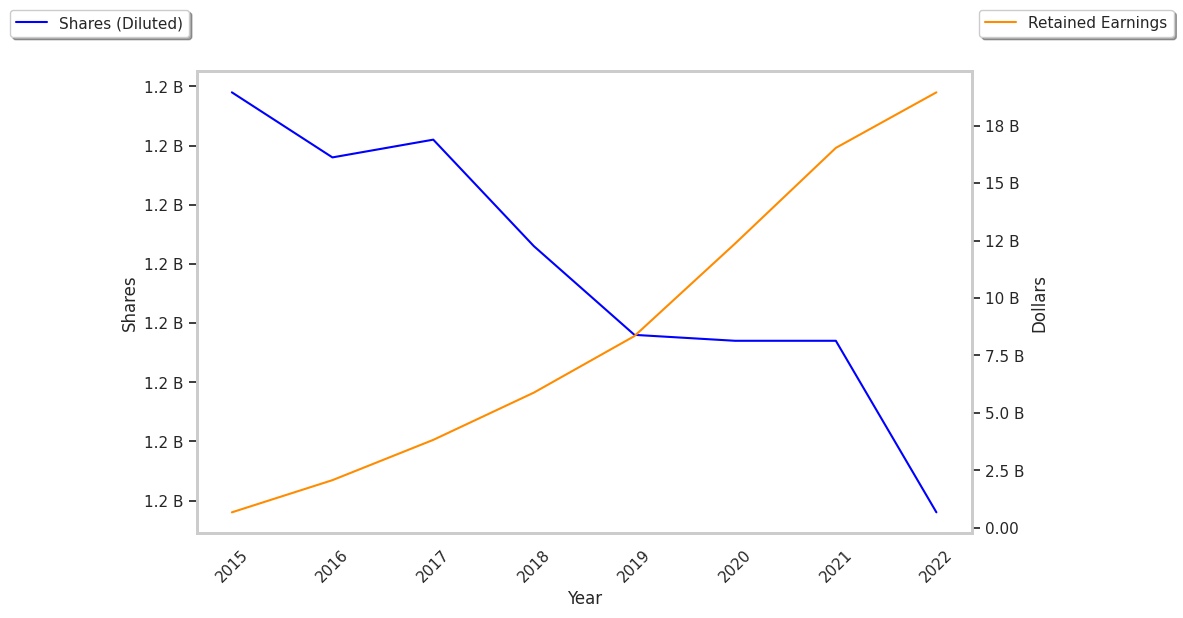
| Diluted Shares (M) | 1,187 | 1,191 | 1,186 | 1,158 | 1,107 | 1,039 |
| Earnings Per Share | $2.07 | $3.54 | $3.52 | $2.09 | $3.84 | $3.99 |
| EPS Growth | n/a | 71.01% | -0.56% | -40.63% | 83.73% | 3.91% |
| Avg. Price | $105.07 | $161.52 | $254.17 | $108.51 | $61.41 | $68.62 |
| P/E Ratio | 50.27 | 45.12 | 71.6 | 51.67 | 15.95 | 17.03 |
| Free Cash Flow (M) | $3,367 | $5,353 | $4,889 | $5,107 | $4,220 | $6,767 |
| CAPEX (M) | $704 | $866 | $908 | $706 | $623 | $683 |
| EV / EBITDA | 33.29 | 43.23 | 54.37 | 25.04 | 11.49 | 12.5 |
| Total Debt (M) | $4,965 | $8,939 | $8,049 | $10,417 | $9,676 | $9,879 |
| Net Debt / EBITDA | -0.66 | 0.93 | 0.52 | 0.51 | 0.1 | 0.54 |
| Current Ratio | 1.43 | 1.33 | 1.22 | 1.28 | 1.29 | 1.28 |
PayPal benefits from rapidly growing revenues and a flat capital expenditure trend, generally positive cash flows, and decent operating margins with a stable trend. The company's financial statements show a strong EPS growth trend and healthy leverage levels. Furthermore, PayPal has just enough current assets to cover current liabilities, as shown by its current ratio of 1.28.