Today we're going to take a closer look at Large-Cap Finance company U.S. Bancorp, whose shares are currently trading at $49.96. We've been asking ourselves whether the company is under or over valued at today's prices... let's perform a brief value analysis to find out!
U.S. Bancorp Is Currently Under Priced:
U.S. Bancorp, a financial services holding company, provides various financial services to individuals, businesses, institutional organizations, governmental entities, and other financial institutions in the United States. The company belongs to the Finance sector, which has an average price to earnings (P/E) ratio of 15.92 and an average price to book (P/B) ratio of 1.78. In contrast, U.S. Bancorp has a trailing 12 month P/E ratio of 12.0 and a P/B ratio of 1.43.
U.S. Bancorp has moved 6.8% over the last year compared to 15.5% for the S&P 500 — a difference of -8.8%. U.S. Bancorp has a 52 week high of $53.98 and a 52 week low of $35.18.
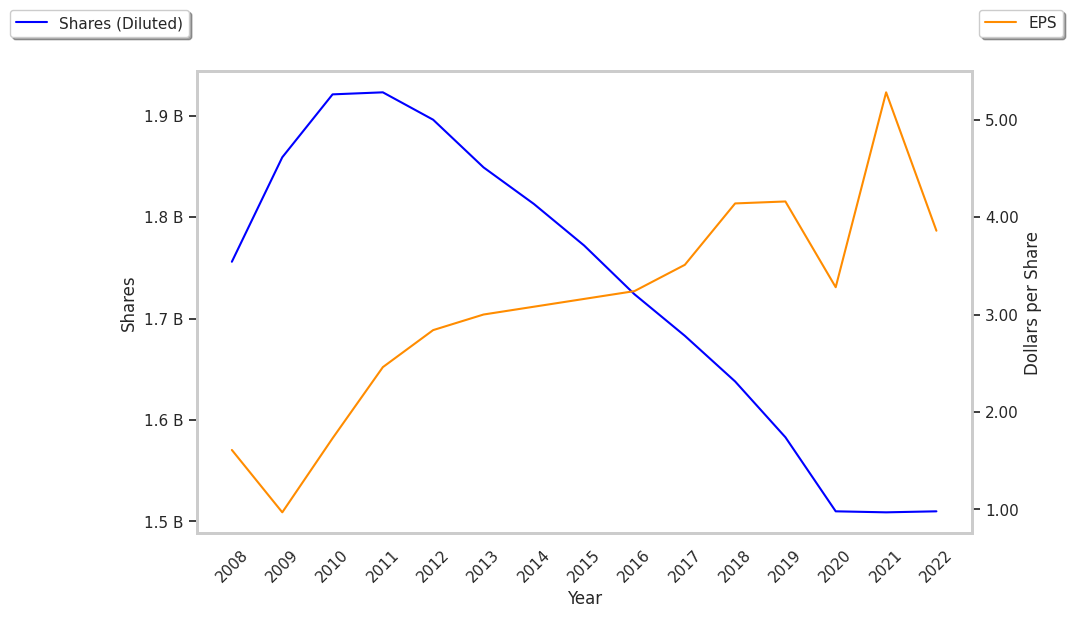
Generally Positive Cash Flows but a Flat EPS Growth Trend:
| 2019 | 2020 | 2021 | 2022 | 2023 | 2024 | |
|---|---|---|---|---|---|---|
| Revenue (M) | $17,494 | $14,840 | $13,487 | $24,302 | $28,144 | $27,455 |
| Interest Income (M) | $13,052 | $12,825 | $12,494 | $14,728 | $17,396 | $16,289 |
| Operating Margins | 49% | 41% | 75% | 30% | 24% | 28% |
| Net Margins | 40% | 33% | 59% | 24% | 19% | 23% |
| Net Income (M) | $6,914 | $4,959 | $7,963 | $5,825 | $5,429 | $6,299 |
| Depreciation & Amort. (M) | $168 | $176 | $159 | $215 | $636 | $569 |
| Diluted Shares (M) | 1,583 | 1,510 | 1,490 | 1,490 | 1,543 | 1,561 |
| Earnings Per Share | $4.16 | $3.06 | $5.1 | $3.69 | $3.27 | $3.79 |
| EPS Growth | n/a | -26.44% | 66.67% | -27.65% | -11.38% | 15.9% |
| Avg. Price | $45.49 | $35.83 | $51.53 | $50.09 | $43.28 | $49.61 |
| P/E Ratio | 10.94 | 11.71 | 10.08 | 13.57 | 13.24 | 13.09 |
| Free Cash Flow (M) | $4,889 | $3,716 | $9,870 | $21,119 | $8,447 | $11,273 |
| EV / EBITDA | 10.34 | 5.34 | 7.81 | 8.06 | 6.42 | 9.29 |
| Total Debt (M) | $40,167 | $41,297 | $32,125 | $39,829 | $43,074 | $58,002 |
| Net Debt / EBITDA | 2.03 | -3.42 | 0.31 | -1.82 | -2.42 | 0.18 |