It's been a great afternoon session for Arista Networks investors, who saw their shares rise 1.7% to a price of $149.21 per share. At these higher prices, is the company still fairly valued? If you are thinking about investing, make sure to check the company's fundamentals before making a decision.
Arista Networks's Valuation Is in Line With Its Sector Averages:
Arista Networks Inc engages in the development, marketing, and sale of data-driven, client to cloud networking solutions for AI, data center, campus, and routing environments in the Americas, Europe, the Middle East, Africa, and the Asia-Pacific. Its cloud networking solutions consist of Extensible Operating System (EOS), a publish-subscribe state-sharing networking operating system offered in combination with a set of network applications. The company belongs to the Telecommunications sector, which has an average price to earnings (P/E) ratio of 18.22 and an average price to book (P/B) ratio of 1.86. In contrast, Arista Networks has a trailing 12 month P/E ratio of 58.5 and a P/B ratio of 17.2.
Arista Networks has moved 52.6% over the last year compared to 16.3% for the S&P 500 — a difference of 36.3%. Arista Networks has a 52 week high of $156.32 and a 52 week low of $59.43.
Wider Gross Margins Than the Industry Average of 39.55%:
| 2019 | 2020 | 2021 | 2022 | 2023 | 2024 | |
|---|---|---|---|---|---|---|
| Revenue (M) | $2,411 | $2,318 | $2,948 | $4,381 | $5,860 | $7,003 |
| Gross Margins | 64% | 64% | 64% | 61% | 62% | 64% |
| Net Margins | 36% | 27% | 28% | 31% | 36% | 41% |
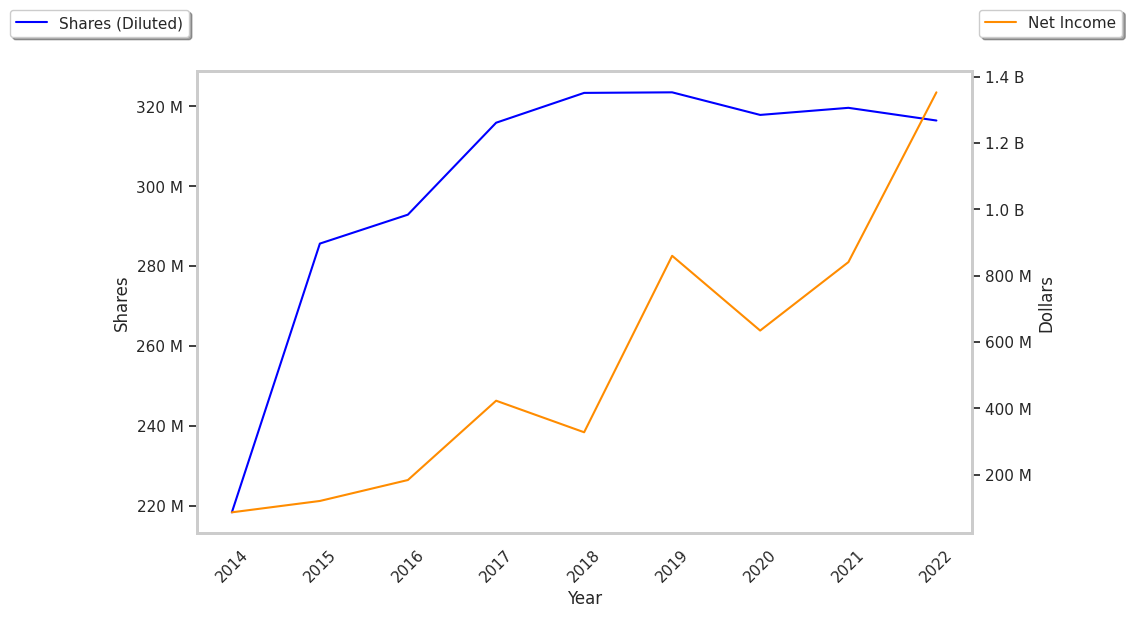
| Net Income (M) | $860 | $635 | $841 | $1,352 | $2,087 | $2,852 |
| Net Interest Expense (M) | $51 | $27 | $7 | $28 | $152 | $311 |
| Depreciation & Amort. (M) | $33 | $35 | $50 | $63 | $71 | $34 |
| Diluted Shares (M) | 1,294 | 1,271 | 1,277 | 1,266 | 1,269 | 1,281 |
| Earnings Per Share | $0.66 | $0.5 | $0.66 | $1.07 | $1.65 | $2.23 |
| EPS Growth | n/a | -24.24% | 32.0% | 62.12% | 54.21% | 35.15% |
| Avg. Price | $15.44 | $14.03 | $23.14 | $29.32 | $58.88 | $149.22 |
| P/E Ratio | 21.75 | 26.98 | 33.54 | 26.65 | 34.64 | 65.45 |
| Free Cash Flow (M) | $947 | $720 | $951 | $448 | $2,000 | $3,676 |
| CAPEX (M) | $16 | $15 | $65 | $45 | $34 | $32 |
| Current Ratio | 5.81 | 4.99 | 4.34 | 4.29 | 4.38 | 4.36 |
Arista Networks benefits from rapidly growing revenues and increasing reinvestment in the business, exceptional EPS growth, and generally positive cash flows. The company's financial statements show an excellent current ratio of 4.36 and wider gross margins than its peer group.