It hasn't been a great afternoon session for Accenture investors, who have watched their shares sink by -2.3% to a price of $234.47. Some of you might be wondering if it's time to buy the dip. If you are considering this, make sure to check the company's fundamentals first to determine if the shares are fairly valued at today's prices.
a Very Low P/E Ratio but Trading Above Its Fair Price:
Accenture plc provides strategy and consulting, industry X, song, and technology and operation services in North America, Europe, the Middle East, Africa, and internationally. The company belongs to the Real Estate sector, which has an average price to earnings (P/E) ratio of 27.31 and an average price to book (P/B) ratio of 1.94. In contrast, Accenture has a trailing 12 month P/E ratio of 18.6 and a P/B ratio of 4.78.
Accenture has moved -29.3% over the last year compared to 16.8% for the S&P 500 — a difference of -46.1%. Accenture has a 52 week high of $398.35 and a 52 week low of $234.1.
Growing Revenues and an Average Current Ratio:
| 2019 | 2020 | 2021 | 2022 | 2023 | 2024 | |
|---|---|---|---|---|---|---|
| Revenue (M) | $43,215 | $44,327 | $50,533 | $61,594 | $64,112 | $64,896 |
| Operating Margins | 15% | 15% | 15% | 15% | 14% | 15% |
| Net Margins | 11% | 12% | 12% | 11% | 11% | 11% |
| Net Income (M) | $4,779 | $5,108 | $5,907 | $6,877 | $6,872 | $7,265 |
| Net Interest Expense (M) | $23 | $33 | $59 | $47 | $48 | $59 |
| Depreciation & Amort. (M) | $893 | $1,773 | $1,891 | $2,088 | $2,281 | $548 |
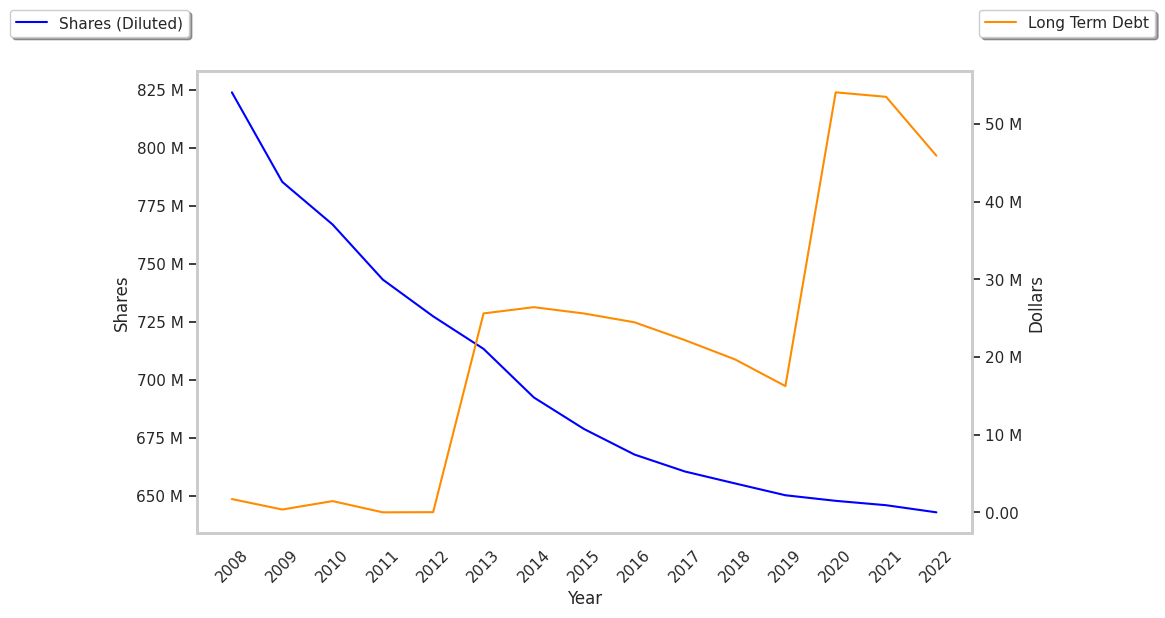
| Diluted Shares (M) | 649 | 647 | 645 | 639 | 637 | 635 |
| Earnings Per Share | $7.36 | $7.89 | $9.16 | $10.71 | $10.77 | $11.44 |
| EPS Growth | n/a | 7.2% | 16.1% | 16.92% | 0.56% | 6.22% |
| Avg. Price | $171.86 | $204.62 | $301.47 | $311.69 | $350.91 | $235.1 |
| P/E Ratio | 22.95 | 25.48 | 32.38 | 28.67 | 32.19 | 20.32 |
| Free Cash Flow (M) | $6,028 | $7,616 | $8,395 | $8,823 | $8,996 | $8,615 |
| CAPEX (M) | $599 | $599 | $580 | $718 | $528 | $517 |
| EV / EBITDA | 14.85 | 15.25 | 20.24 | 17.59 | 20.41 | 15.29 |
| Total Debt (M) | $20 | $69 | $65 | $55 | $147 | $5,154 |
| Net Debt / EBITDA | -0.8 | -1.03 | -0.59 | -0.51 | -0.63 | -0.31 |
| Current Ratio | 1.39 | 1.45 | 1.22 | 1.26 | 1.33 | 1.47 |
Accenture has growing revenues and a flat capital expenditure trend and positive EPS growth. Additionally, the company's financial statements display generally positive cash flows and healthy leverage levels. However, the firm has weak operating margins with a stable trend. Finally, we note that Accenture has just enough current assets to cover current liabilities, as shown by its current ratio of 1.47.