Today we're going to take a closer look at Large-Cap Industrials company Norfolk Southern, whose shares are currently trading at $292.25. We've been asking ourselves whether the company is under or over valued at today's prices... let's perform a brief value analysis to find out!
a Very Low P/E Ratio but Trading Above Its Fair Price:
Norfolk Southern Corporation, together with its subsidiaries, engages in the rail transportation of raw materials, intermediate products, and finished goods in the United States. The company belongs to the Industrials sector, which has an average price to earnings (P/E) ratio of 24.03 and an average price to book (P/B) ratio of 2.89. In contrast, Norfolk Southern has a trailing 12 month P/E ratio of 19.7 and a P/B ratio of 4.44.
Norfolk Southern has moved 17.7% over the last year compared to 16.8% for the S&P 500 — a difference of 0.9%. Norfolk Southern has a 52 week high of $294.78 and a 52 week low of $201.63.
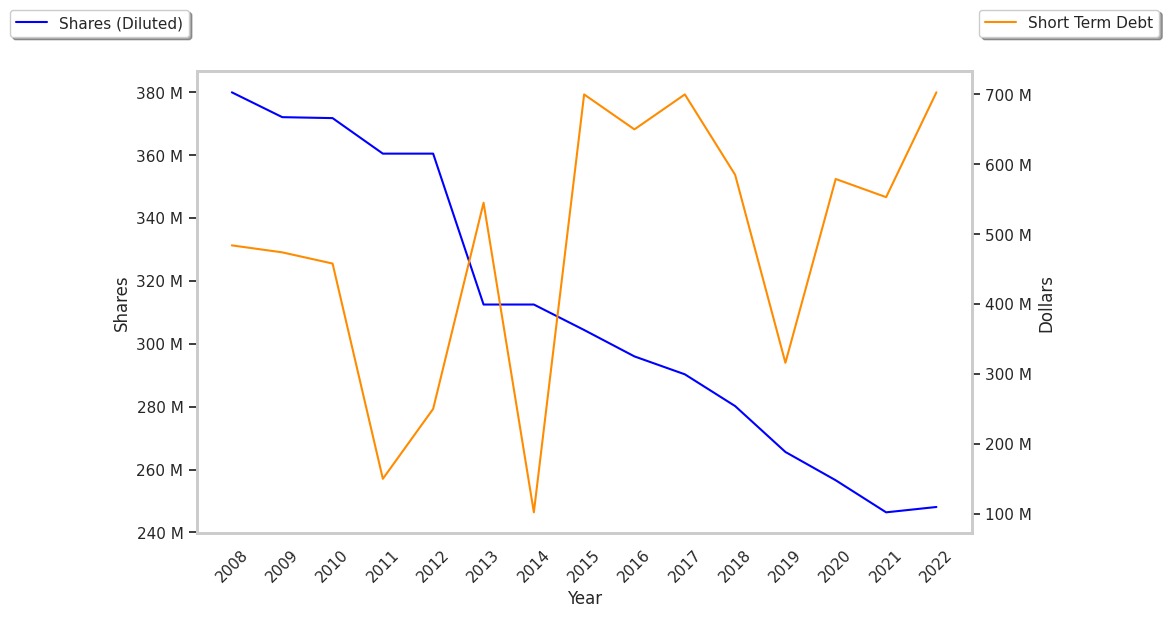
EPS Trend Sustained Primarily by Reducing the Number of Shares Outstanding:
| 2019 | 2020 | 2021 | 2022 | 2023 | 2024 | |
|---|---|---|---|---|---|---|
| Revenue (M) | $11,296 | $9,789 | $11,142 | $12,745 | $12,156 | $12,123 |
| Operating Margins | 35% | 31% | 40% | 38% | 23% | 34% |
| Net Margins | 24% | 21% | 27% | 26% | 15% | 22% |
| Net Income (M) | $2,722 | $2,013 | $3,005 | $3,270 | $1,827 | $2,622 |
| Net Interest Expense (M) | $604 | $625 | $646 | $692 | $722 | $807 |
| Depreciation & Amort. (M) | $1,138 | $1,154 | $1,181 | $1,221 | $1,298 | $1,353 |
| Diluted Shares (M) | 266 | 257 | 248 | 236 | 227 | 226 |
| Earnings Per Share | $10.25 | $7.84 | $12.11 | $13.88 | $8.02 | $11.57 |
| EPS Growth | n/a | -23.51% | 54.46% | 14.62% | -42.22% | 44.26% |
| Avg. Price | $172.39 | $185.27 | $256.24 | $252.5 | $236.38 | $290.55 |
| P/E Ratio | 16.7 | 23.51 | 21.07 | 18.14 | 29.4 | 25.09 |
| Free Cash Flow (M) | $1,873 | $2,143 | $2,785 | $2,274 | $852 | $1,671 |
| CAPEX (M) | $2,019 | $1,494 | $1,470 | $1,948 | $2,327 | $2,381 |
| EV / EBITDA | 11.26 | 14.28 | 13.78 | 12.48 | 16.74 | 14.97 |
| Total Debt (M) | $12,196 | $12,681 | $13,840 | $15,182 | $17,179 | $17,206 |
| Net Debt / EBITDA | 2.27 | 2.78 | 2.31 | 2.44 | 3.76 | 2.87 |
| Current Ratio | 0.9 | 1.07 | 0.86 | 0.76 | 1.24 | 0.9 |