Now trading at a price of $100.35, PACCAR has moved 5.0% so far today.
Over the last year, PACCAR logged a -2.6% change, with its stock price reaching a high of $118.81 and a low of $84.65. Over the same period, the stock underperformed the S&P 500 index by -17.7%. AThe company's 50-day average price was $98.83. PACCAR Inc designs, manufactures, and distributes light, medium, and heavy-duty commercial trucks in the United States, Canada, Europe, Mexico, South America, Australia, and internationally. It operates through three segments: Truck, Parts, and Financial Services. Based in Bellevue, WA, the Large-Cap Consumer Discretionary company has 30,100 full time employees. PACCAR has offered a 1.3% dividend yield over the last 12 months.
Growing Revenues and Healthy Leverage Levels:
| 2019 | 2020 | 2021 | 2022 | 2023 | 2024 | |
|---|---|---|---|---|---|---|
| Revenue (M) | $25,600 | $18,728 | $23,522 | $28,820 | $35,127 | $33,664 |
| Operating Margins | 12% | 9% | 10% | 13% | 16% | 16% |
| Net Margins | 9% | 7% | 8% | 10% | 13% | 12% |
| Net Income (M) | $2,388 | $1,301 | $1,866 | $3,012 | $4,601 | $4,162 |
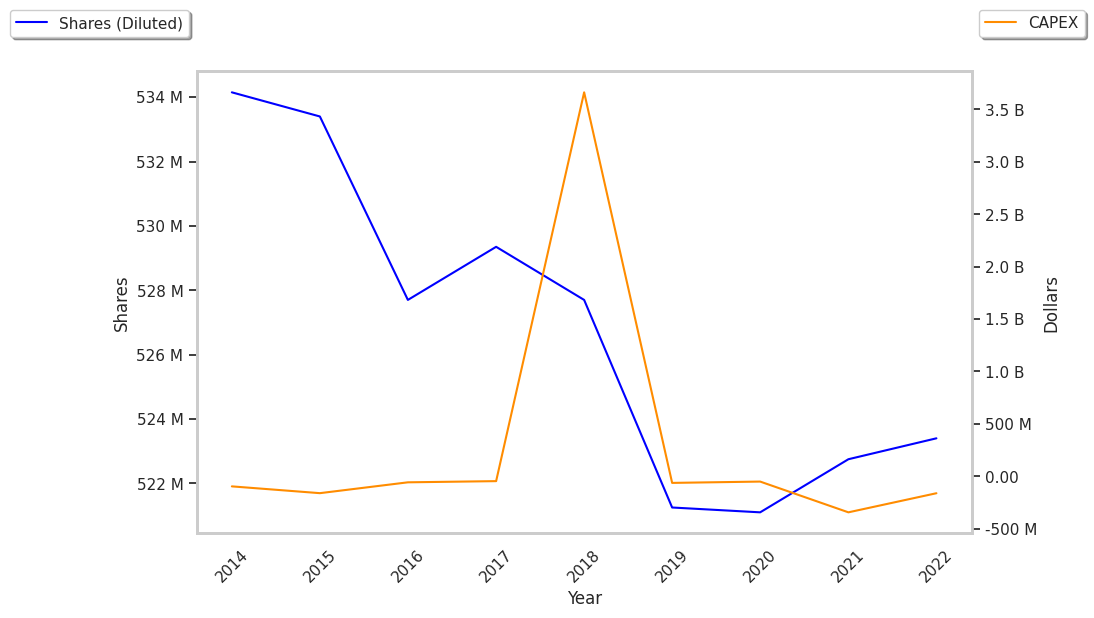
| Diluted Shares (M) | 348 | 521 | 523 | 523 | 525 | 527 |
| Earnings Per Share | $6.87 | $2.5 | $3.57 | $5.75 | $8.76 | $7.9 |
| EPS Growth | n/a | -63.61% | 42.8% | 61.06% | 52.35% | -9.82% |
| Avg. Price | $40.6 | $47.4 | $54.99 | $55.89 | $97.65 | $100.25 |
| P/E Ratio | 5.9 | 18.96 | 15.36 | 9.7 | 11.12 | 12.66 |
| Free Cash Flow (M) | $2,286 | $2,437 | $1,628 | $2,502 | $3,495 | $3,802 |
| CAPEX (M) | $574 | $550 | $559 | $525 | $695 | $839 |
| EV / EBITDA | 3.51 | 7.56 | 9.85 | 6.3 | 9.53 | 9.71 |
| Total Debt (M) | $1,162 | $1,429 | $10,432 | $11,472 | $14,234 | $15,895 |
| Net Debt / EBITDA | -0.6 | -1.03 | 2.69 | 1.66 | 1.21 | 1.4 |
PACCAR benefits from growing revenues and increasing reinvestment in the business, strong operating margins with a positive growth rate, and generally positive cash flows. The company's financial statements show positive EPS growth and healthy leverage levels.
an Increase in Expected Earnings Improves Its Value Outlook but Its Shares Are Expensive:
PACCAR has a trailing twelve month P/E ratio of 17.0, compared to an average of 20.93 for the Consumer Discretionary sector. Based on its EPS guidance of $7.76, the company has a forward P/E ratio of 12.7. The 1.8% compound average growth rate of PACCAR's historical and projected earnings per share yields a PEG ratio of 9.66. This suggests that these shares are overvalued. In contrast, the market is likely undervaluing PACCAR in terms of its equity because its P/B ratio is 2.78 while the sector average is 2.93. The company's shares are currently trading 30.5% below their Graham number.
PACCAR Has an Analyst Consensus of Some Upside Potential:
PACCAR has an average amount of shares sold short because 2.7% of the company's shares are sold short. Institutions own 72.8% of the company's shares, and the insider ownership rate stands at 1.92%, suggesting a large amount of insider shareholders. The largest shareholder is Vanguard Group Inc, whose 12% stake in the company is worth $6,284,495,522.