We've been asking ourselves recently if the market has placed a fair valuation on Gilead Sciences. Let's dive into some of the fundamental values of this Large-Cap Health Care company to determine if there might be an opportunity here for value-minded investors.
an Increase in Expected Earnings Improves Its Value Outlook but Its Shares Are Expensive:
Gilead Sciences, Inc., a biopharmaceutical company, discovers, develops, and commercializes medicines in the areas of unmet medical need in the United States, Europe, and internationally. The company belongs to the Health Care sector, which has an average price to earnings (P/E) ratio of 22.94 and an average price to book (P/B) ratio of 3.19. In contrast, Gilead Sciences has a trailing 12 month P/E ratio of 22.2 and a P/B ratio of 7.07.
Gilead Sciences has moved 31.0% over the last year compared to 17.1% for the S&P 500 — a difference of 13.8%. Gilead Sciences has a 52 week high of $121.83 and a 52 week low of $83.1.
The Company Has a Highly Leveraged Balance Sheet and a Declining EPS Growth Trend:
| 2019 | 2020 | 2021 | 2022 | 2023 | 2024 | |
|---|---|---|---|---|---|---|
| Revenue (M) | $22,449 | $24,689 | $27,305 | $27,281 | $27,116 | $28,754 |
| Operating Margins | 19% | 16% | 36% | 27% | 28% | 6% |
| Net Margins | 24% | 0% | 23% | 17% | 21% | 2% |
| Net Income (M) | $5,386 | $123 | $6,225 | $4,592 | $5,665 | $480 |
| Net Interest Expense (M) | $995 | $984 | $1,001 | $935 | $944 | $951 |
| Depreciation & Amort. (M) | $255 | $288 | $329 | $323 | $354 | $381 |
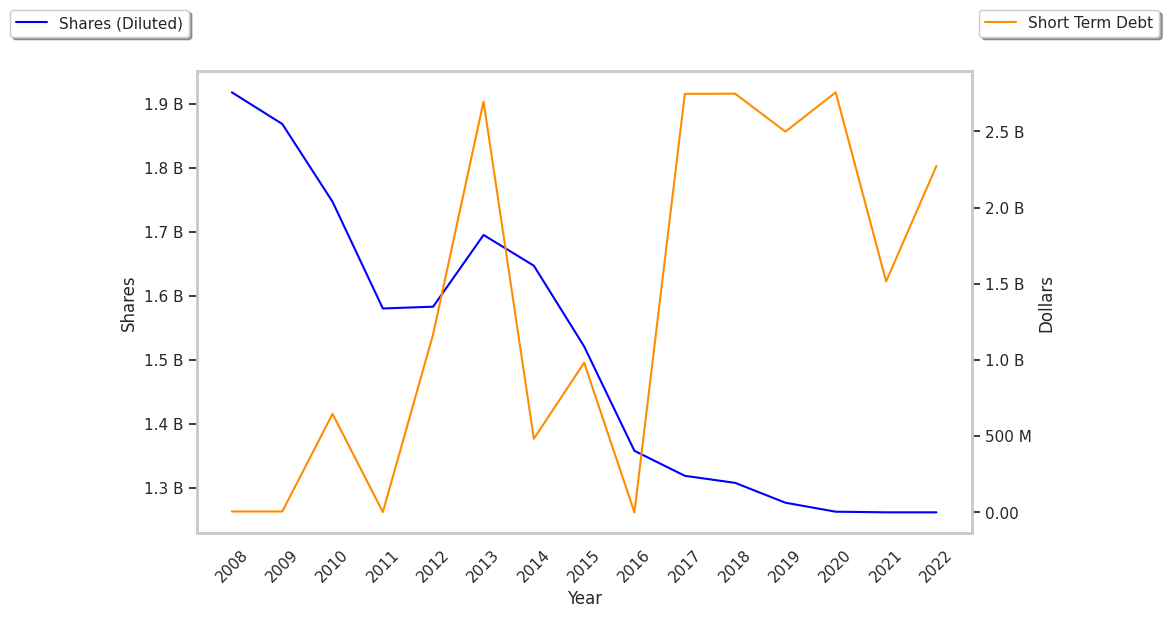
| Diluted Shares (M) | 1,277 | 1,263 | 1,262 | 1,262 | 1,258 | 1,255 |
| Earnings Per Share | $4.22 | $0.1 | $4.93 | $3.64 | $4.5 | $0.38 |
| EPS Growth | n/a | -97.63% | 4830.0% | -26.17% | 23.63% | -91.56% |
| Avg. Price | $55.56 | $60.46 | $62.06 | $59.6 | $81.01 | $111.0 |
| P/E Ratio | 13.1 | 604.6 | 12.51 | 16.28 | 17.84 | 292.11 |
| Free Cash Flow (M) | $8,319 | $7,518 | $10,805 | $8,344 | $7,421 | $10,305 |
| CAPEX (M) | $825 | $650 | $579 | $728 | $585 | $523 |
| EV / EBITDA | 18.46 | 23.99 | 9.84 | 12.65 | 15.29 | 76.76 |
| Total Debt (M) | $24,593 | $34,159 | $28,211 | $27,502 | $26,785 | $28,525 |
| Net Debt / EBITDA | 2.85 | 6.46 | 2.23 | 2.89 | 2.6 | 9.07 |
| Current Ratio | 3.1 | 1.4 | 1.27 | 1.29 | 1.43 | 1.6 |
Gilead Sciences has weak operating margins with a negative growth trend, declining EPS growth, and a highly leveraged balance sheet. On the other hand, the company benefits from generally positive cash flows and a decent current ratio of 1.6. Furthermore, Gilead Sciences has growing revenues and decreasing reinvestment in the business.