It hasn't been a great afternoon session for Halozyme Therapeutics investors, who have watched their shares sink by -4.8% to a price of $71.34. Some of you might be wondering if it's time to buy the dip. If you are considering this, make sure to check the company's fundamentals first to determine if the shares are fairly valued at today's prices.
a Very Low P/E Ratio but Trades Above Its Graham Number:
Halozyme Therapeutics, Inc., a biopharmaceutical company, researches, develops, and commercializes of proprietary enzymes and devices in the United States and internationally. The company belongs to the Health Care sector, which has an average price to earnings (P/E) ratio of 22.94 and an average price to book (P/B) ratio of 3.19. In contrast, Halozyme Therapeutics has a trailing 12 month P/E ratio of 16.3 and a P/B ratio of 25.22.
Halozyme Therapeutics has moved 24.0% over the last year compared to 17.7% for the S&P 500 — a difference of 6.3%. Halozyme Therapeutics has a 52 week high of $79.5 and a 52 week low of $42.01.
Strong Revenue Growth and Healthy Leverage Levels:
| 2019 | 2020 | 2021 | 2022 | 2023 | 2024 | |
|---|---|---|---|---|---|---|
| Revenue (k) | $195,992 | $267,594 | $443,310 | $660,116 | $829,253 | $1,015,324 |
| Operating Margins | -34% | 54% | 62% | 41% | 41% | 54% |
| Net Margins | -37% | 48% | 91% | 31% | 34% | 44% |
| Net Income (k) | -$72,240 | $129,085 | $402,710 | $202,129 | $281,594 | $444,091 |
| Net Interest Expense (k) | $11,627 | $20,378 | $7,526 | $16,947 | $18,762 | $10,565 |
| Depreciation & Amort. (k) | $4,068 | $3,284 | $2,997 | $6,493 | $11,083 | $10,263 |
| Diluted Shares (k) | 141,046 | 145,122 | 146,796 | 140,608 | 134,197 | 129,424 |
| Earnings Per Share | -$0.5 | $0.91 | $2.74 | $1.44 | $2.1 | $3.43 |
| EPS Growth | n/a | 282.0% | 201.1% | -47.45% | 45.83% | 63.33% |
| Avg. Price | $16.54 | $26.41 | $42.22 | $39.76 | $36.96 | $71.91 |
| P/E Ratio | -33.08 | 27.8 | 14.76 | 26.86 | 17.35 | 20.55 |
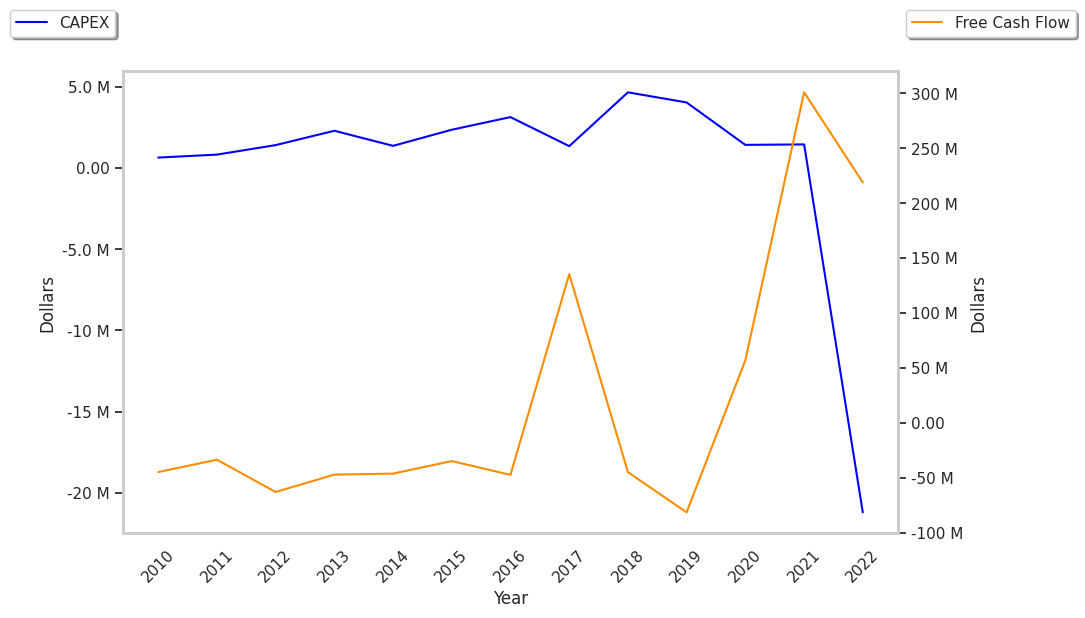
| Free Cash Flow (k) | -$89,463 | $52,950 | $297,983 | $235,300 | $373,277 | $468,368 |
| CAPEX (k) | $4,040 | $2,504 | $1,457 | $4,810 | $15,294 | $10,696 |
| EV / EBITDA | -42.2 | 26.43 | 23.2 | 24.67 | 18.31 | 18.71 |
| Total Debt (k) | $402,587 | $397,228 | $876,674 | $1,519,434 | $1,499,248 | $1,505,798 |
| Net Debt / EBITDA | -4.44 | 1.69 | 2.72 | 4.69 | 3.96 | 2.47 |
| Current Ratio | 6.35 | 1.32 | 7.91 | 5.65 | 6.64 | 7.8 |
Halozyme Therapeutics has rapidly growing revenues and increasing reinvestment in the business, strong operating margins with a positive growth rate, and exceptional EPS growth. The company also benefits from generally positive cash flows, an excellent current ratio of 7.8, and healthy leverage levels.