Agilent Technologies logged a 2.6% change during today's afternoon session, and is now trading at a price of $142.28 per share.
Over the last year, Agilent Technologies logged a -4.3% change, with its stock price reaching a high of $153.84 and a low of $96.43. Over the same period, the stock underperformed the S&P 500 index by -21.1%. AThe company's 50-day average price was $122.23. Agilent Technologies, Inc. provides application focused solutions to the life sciences, diagnostics, and applied chemical markets worldwide. Based in Santa Clara, CA, the Large-Cap Industrials company has 18,000 full time employees. Agilent Technologies has offered a 0.7% dividend yield over the last 12 months.
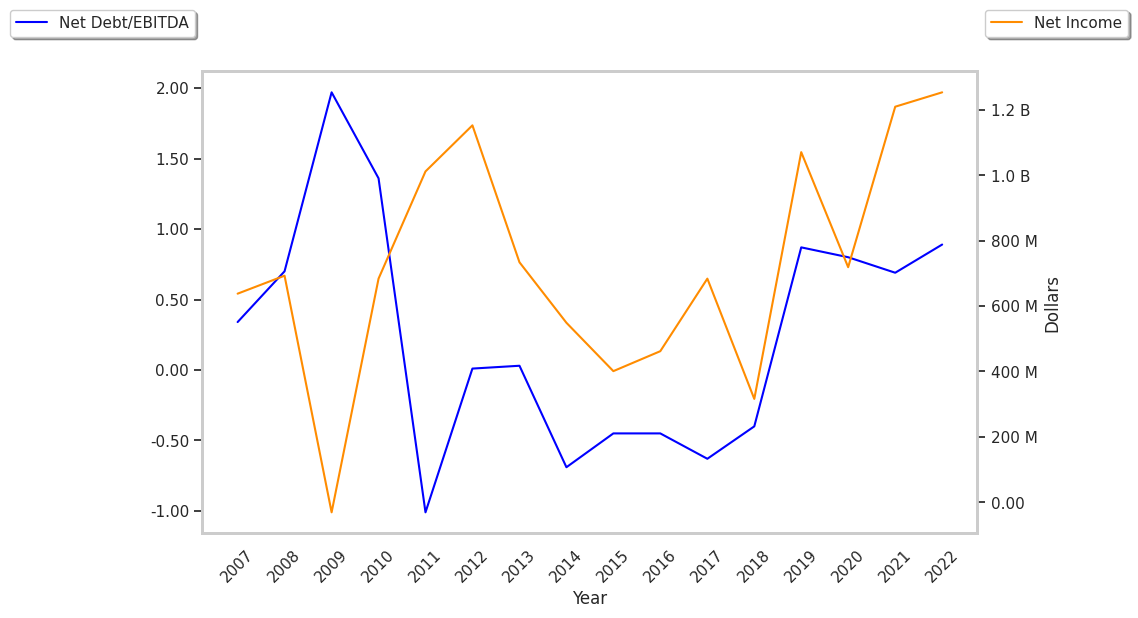
Growing Revenues and Healthy Leverage Levels:
| 2019 | 2020 | 2021 | 2022 | 2023 | 2024 | |
|---|---|---|---|---|---|---|
| Revenue (M) | $5,163 | $5,339 | $6,319 | $6,848 | $6,833 | $6,510 |
| Operating Margins | 18% | 16% | 21% | 24% | 20% | 23% |
| Net Margins | 21% | 13% | 19% | 18% | 18% | 20% |
| Net Income (M) | $1,071 | $719 | $1,210 | $1,254 | $1,240 | $1,289 |
| Net Interest Expense (M) | $74 | $78 | $81 | $84 | $95 | $96 |
| Depreciation & Amort. (M) | $238 | $308 | $321 | $317 | $271 | $149 |
| Diluted Shares (M) | 318 | 312 | 307 | 300 | 296 | 291 |
| Earnings Per Share | $3.37 | $2.3 | $3.94 | $4.18 | $4.19 | $4.43 |
| EPS Growth | n/a | -31.75% | 71.3% | 6.09% | 0.24% | 5.73% |
| Avg. Price | $73.1 | $90.72 | $142.77 | $128.75 | $139.03 | $142.12 |
| P/E Ratio | 21.44 | 38.94 | 35.87 | 30.73 | 32.95 | 32.01 |
| Free Cash Flow (M) | $866 | $802 | $1,297 | $1,021 | $1,474 | $1,373 |
| CAPEX (M) | $155 | $119 | $188 | $291 | $298 | $378 |
| EV / EBITDA | 20.1 | 24.92 | 26.6 | 20.59 | 25.84 | 26.05 |
| Total Debt (M) | $2,402 | $2,359 | $2,729 | $2,769 | $2,735 | $3,390 |
| Net Debt / EBITDA | 0.87 | 0.8 | 0.75 | 0.89 | 0.71 | 1.26 |
| Current Ratio | 1.53 | 2.33 | 2.22 | 2.03 | 2.61 | 2.09 |
Agilent Technologies has growing revenues and increasing reinvestment in the business, generally positive cash flows, and an excellent current ratio of 2.09. The company also benefits from decent operating margins with a positive growth rate, positive EPS growth, and healthy leverage levels.
Agilent Technologies's Valuation Is in Line With Its Sector Averages:
Agilent Technologies has a trailing twelve month P/E ratio of 28.5, compared to an average of 24.03 for the Industrials sector. Based on its EPS guidance of $5.65, the company has a forward P/E ratio of 21.6. The 7.7% compound average growth rate of Agilent Technologies's historical and projected earnings per share yields a PEG ratio of 3.72. This suggests that these shares are overvalued. Furthermore, Agilent Technologies is likely overvalued compared to the book value of its equity, since its P/B ratio of 6.33 is higher than the sector average of 2.89. The company's shares are currently trading 216.5% below their Graham number. Ultimately, Agilent Technologies's strong cash flows, decent earnings multiple, and healthy debt levels factor towards it being fairly valued, its elevated P/B ratio notwithstanding.
Agilent Technologies Has an Average Rating of Buy:
The 15 analysts following Agilent Technologies have set target prices ranging from $120.0 to $165.0 per share, for an average of $140.3 with a buy rating. The company is trading 1.4% away from its average target price, indicating that there is an analyst consensus of little upside potential.
Agilent Technologies has a very low short interest because 1.3% of the company's shares are sold short. Institutions own 92.7% of the company's shares, and the insider ownership rate stands at 0.29%, suggesting a small amount of insider investors. The largest shareholder is Vanguard Group Inc, whose 12% stake in the company is worth $4,837,213,345.