Starbucks logged a -4.7% change during today's afternoon session, and is now trading at a price of $82.35 per share.
Starbucks returned losses of -10.1% last year, with its stock price reaching a high of $117.46 and a low of $75.5. Over the same period, the stock underperformed the S&P 500 index by -28.0%. AThe company's 50-day average price was $87.68. Starbucks Corporation, together with its subsidiaries, operates as a roaster, marketer, and retailer of coffee worldwide. Based in Seattle, WA, the Large-Cap Consumer Discretionary company has 361,000 full time employees. Starbucks has offered a 2.8% dividend yield over the last 12 months.
EPS Trend Sustained Primarily by Reducing the Number of Shares Outstanding:
| 2019 | 2020 | 2021 | 2022 | 2023 | 2024 | |
|---|---|---|---|---|---|---|
| Revenue (M) | $26,509 | $23,518 | $29,061 | $32,250 | $35,976 | $36,176 |
| Operating Margins | 15% | 7% | 17% | 14% | 16% | 15% |
| Net Margins | 14% | 4% | 14% | 10% | 11% | 10% |
| Net Income (M) | $3,599 | $928 | $4,199 | $3,282 | $4,124 | $3,761 |
| Net Interest Expense (M) | $331 | $437 | $470 | $483 | $550 | $562 |
| Depreciation & Amort. (M) | $1,377 | $1,431 | $1,442 | $1,448 | $1,363 | $1,513 |
| Diluted Shares (M) | 1,191 | 1,183 | 1,186 | 1,158 | 1,141 | 1,138 |
| Earnings Per Share | $3.02 | $0.78 | $3.54 | $2.83 | $3.62 | $3.3 |
| EPS Growth | n/a | -74.17% | 353.85% | -20.06% | 27.92% | -8.84% |
| Avg. Price | $75.3 | $78.1 | $107.51 | $83.01 | $96.01 | $82.79 |
| P/E Ratio | 24.69 | 98.86 | 30.03 | 29.02 | 26.45 | 24.94 |
| Free Cash Flow (M) | $3,240 | $114 | $4,519 | $2,556 | $3,675 | $3,318 |
| CAPEX (M) | $1,807 | $1,484 | $1,470 | $1,841 | $2,334 | $2,778 |
| EV / EBITDA | 17.79 | 39.0 | 23.43 | 19.86 | 18.57 | 17.35 |
| Total Debt (M) | $11,152 | $30,083 | $28,233 | $27,989 | $28,213 | $29,881 |
| Net Debt / EBITDA | 1.49 | 8.37 | 3.45 | 4.15 | 3.49 | 3.79 |
| Current Ratio | 0.68 | 1.06 | 1.2 | 0.77 | 0.7 | 0.75 |
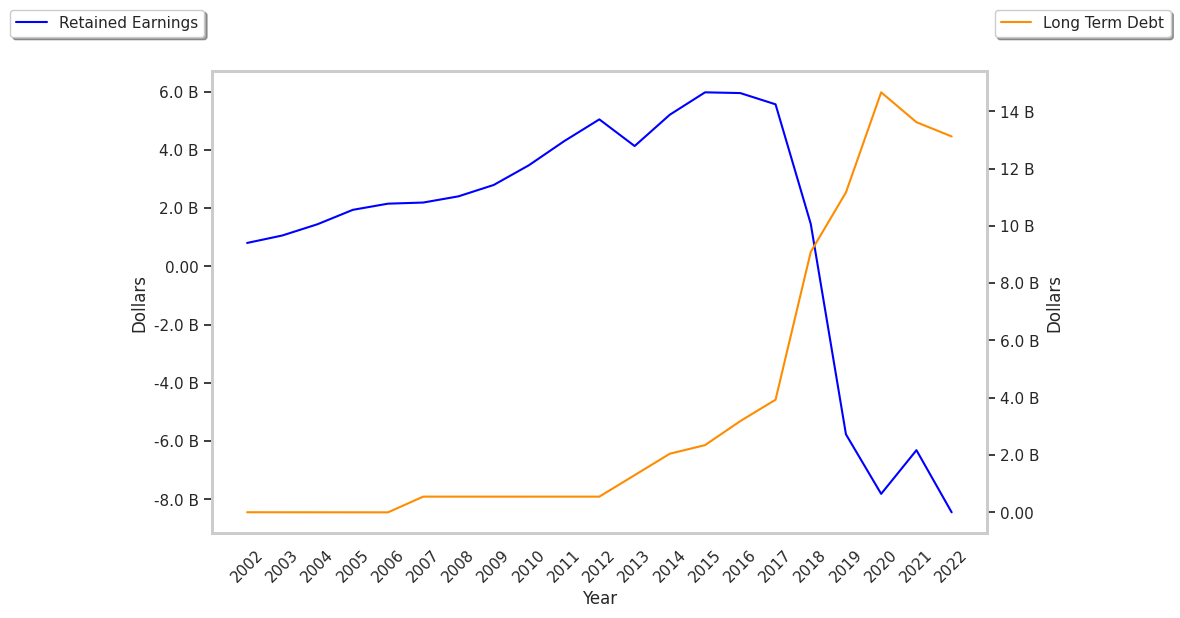
Starbucks has growing revenues and increasing reinvestment in the business, strong operating margins with a stable trend, and generally positive cash flows. However, Starbucks has EPS growth achieved by reducing the number of outstanding shares, not enough current assets to cover current liabilities because its current ratio is 0.75, and a highly leveraged balance sheet.
Starbucks's Valuation Is in Line With Its Sector Averages:
Starbucks has a trailing twelve month P/E ratio of 38.0, compared to an average of 20.93 for the Consumer Discretionary sector. Based on its EPS guidance of $3.72, the company has a forward P/E ratio of 23.6. The 3.0% compound average growth rate of Starbucks's historical and projected earnings per share yields a PEG ratio of 12.56. This suggests that these shares are overvalued.
Starbucks Has an Analyst Consensus of Some Upside Potential:
The 30 analysts following Starbucks have set target prices ranging from $73.0 to $115.0 per share, for an average of $97.97 with a buy rating. The company is trading -15.9% away from its average target price, indicating that there is an analyst consensus of some upside potential.
Starbucks has an average amount of shares sold short because 3.9% of the company's shares are sold short. Institutions own 87.1% of the company's shares, and the insider ownership rate stands at 0.16%, suggesting a small amount of insider investors. The largest shareholder is Vanguard Group Inc, whose 10% stake in the company is worth $9,294,165,675.