M&T Bank logged a -0.3% change during today's afternoon session, and is now trading at a price of $189.39 per share.
M&T Bank returned gains of 7.0% last year, with its stock price reaching a high of $225.7 and a low of $150.75. Over the same period, the stock underperformed the S&P 500 index by -10.2%. The company's 50-day average price was $195.31. M&T Bank Corporation operates as a bank holding company for Manufacturers and Traders Trust Company and Wilmington Trust, National Association that provides retail and commercial banking products and services in the United States. Based in Buffalo, NY, the Large-Cap Finance company has 22,590 full time employees. M&T Bank has offered a 2.8% dividend yield over the last 12 months.
Increasing Revenues but Narrowing Margins:
| 2019 | 2020 | 2021 | 2022 | 2023 | 2024 | |
|---|---|---|---|---|---|---|
| Revenue (M) | $4,880 | $4,193 | $3,939 | $6,247 | $10,224 | $11,026 |
| Interest Income (M) | $4,130 | $3,866 | $3,825 | $5,822 | $7,115 | $6,852 |
| Operating Margins | 52% | 42% | 62% | 42% | 35% | 30% |
| Net Margins | 40% | 32% | 47% | 32% | 27% | 23% |
| Net Income (M) | $1,929 | $1,353 | $1,859 | $1,992 | $2,741 | $2,588 |
| Depreciation & Amort. (M) | $19 | $15 | $10 | $56 | $62 | $316 |
| Diluted Shares (M) | 134 | 129 | 129 | 164 | 167 | 167 |
| Earnings Per Share | $13.75 | $9.94 | $13.8 | $11.53 | $15.79 | $14.64 |
| EPS Growth | n/a | -27.71% | 38.83% | -16.45% | 36.95% | -7.28% |
| Avg. Price | $142.84 | $106.1 | $139.96 | $164.91 | $137.08 | $190.0 |
| P/E Ratio | 10.38 | 10.67 | 10.13 | 14.23 | 8.65 | 12.92 |
| Free Cash Flow (M) | $2,180 | $617 | $2,566 | $4,360 | $3,649 | $3,394 |
| CAPEX (M) | $178 | $172 | $149 | $214 | $256 | $216 |
| EV / EBITDA | 9.87 | 9.34 | 8.18 | 8.89 | 8.01 | 11.68 |
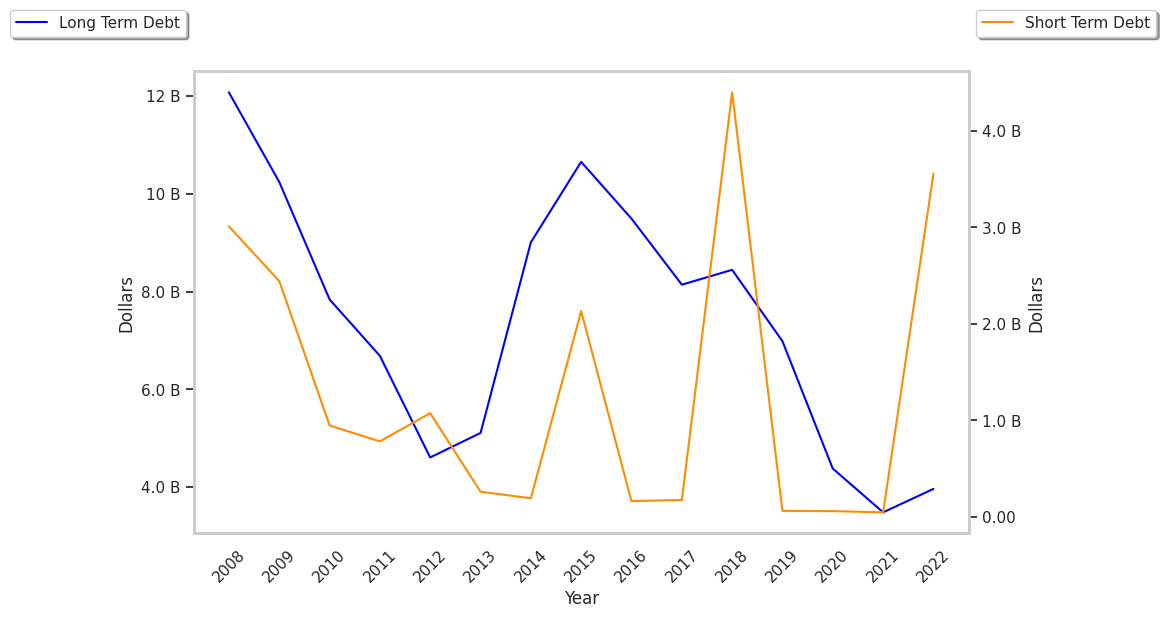
| Total Debt (M) | $6,986 | $4,382 | $3,485 | $3,965 | $8,201 | $12,605 |
| Net Debt / EBITDA | 2.16 | 1.59 | 0.87 | 0.92 | 1.76 | 2.95 |
M&T Bank has rapidly growing revenues and increasing reinvestment in the business and generally positive cash flows. Additionally, the company's financial statements display positive EPS growth and reasonable leverage levels. Furthermore, M&T Bank has decent net margins with a negative growth trend.
M&T Bank Is Potentially Undervalued and Trades Below Its Fair Value:
M&T Bank has a trailing twelve month P/E ratio of 12.7, compared to an average of 15.92 for the Finance sector. Based on its EPS guidance of $16.28, the company has a forward P/E ratio of 12.0. The 2.4% compound average growth rate of M&T Bank's historical and projected earnings per share yields a PEG ratio of 5.18. This suggests that these shares are overvalued. In contrast, the market is likely undervaluing M&T Bank in terms of its equity because its P/B ratio is 1.13 while the sector average is 1.78. The company's shares are currently trading -20.8% above their Graham number.
M&T Bank Has an Analyst Consensus of Some Upside Potential:
The 21 analysts following M&T Bank have set target prices ranging from $180.0 to $251.0 per share, for an average of $220.43 with a buy rating. The company is trading -14.1% away from its average target price, indicating that there is an analyst consensus of some upside potential.
M&T Bank has an average amount of shares sold short because 3.6% of the company's shares are sold short. Institutions own 89.0% of the company's shares, and the insider ownership rate stands at 0.4%, suggesting a small amount of insider investors. The largest shareholder is Vanguard Group Inc, whose 12% stake in the company is worth $3,651,127,073.