O'Reilly Automotive logged a 0.3% change during today's morning session, and is now trading at a price of $102.42 per share.
O'Reilly Automotive returned gains of 27.4% last year, with its stock price reaching a high of $108.72 and a low of $76.22. Over the same period, the stock outperformed the S&P 500 index by 15.6%. More recently, the company's 50-day average price was $103.81. O'Reilly Automotive, Inc., together with its subsidiaries, operates as a retailer and supplier of automotive aftermarket parts, tools, supplies, equipment, and accessories in the United States, Puerto Rico, Mexico, and Canada. Based in Springfield, MO, the Large-Cap Consumer Discretionary company has 92,810 full time employees. O'Reilly Automotive has not offered a dividend during the last year.
Wider Gross Margins Than the Industry Average of 41.4%:
| 2019 | 2020 | 2021 | 2022 | 2023 | 2024 | |
|---|---|---|---|---|---|---|
| Revenue (M) | $10,150 | $11,604 | $13,328 | $14,410 | $15,812 | $16,708 |
| Gross Margins | 53% | 52% | 53% | 51% | 51% | 51% |
| Net Margins | 14% | 15% | 16% | 15% | 15% | 14% |
| Net Income (M) | $1,391 | $1,752 | $2,165 | $2,173 | $2,347 | $2,387 |
| Net Interest Expense (M) | $140 | $161 | $145 | $158 | $202 | $223 |
| Depreciation & Amort. (M) | $271 | $315 | $328 | $358 | $409 | $462 |
| Diluted Shares (M) | 78 | 74 | 70 | 65 | 61 | 59 |
| Earnings Per Share | $17.88 | $23.53 | $31.1 | $33.44 | $38.47 | $40.66 |
| EPS Growth | n/a | 31.6% | 32.17% | 7.52% | 15.04% | 5.69% |
| Avg. Price | $390.22 | $421.41 | $564.36 | $657.44 | $950.08 | $102.15 |
| P/E Ratio | 21.59 | 17.75 | 17.98 | 19.48 | 24.49 | 2.5 |
| Free Cash Flow (M) | $1,080 | $2,371 | $2,764 | $2,585 | $2,028 | $2,026 |
| CAPEX (M) | $628 | $466 | $443 | $563 | $1,006 | $1,023 |
| EV / EBITDA | 15.71 | 12.88 | 13.37 | 14.51 | 17.81 | 3.08 |
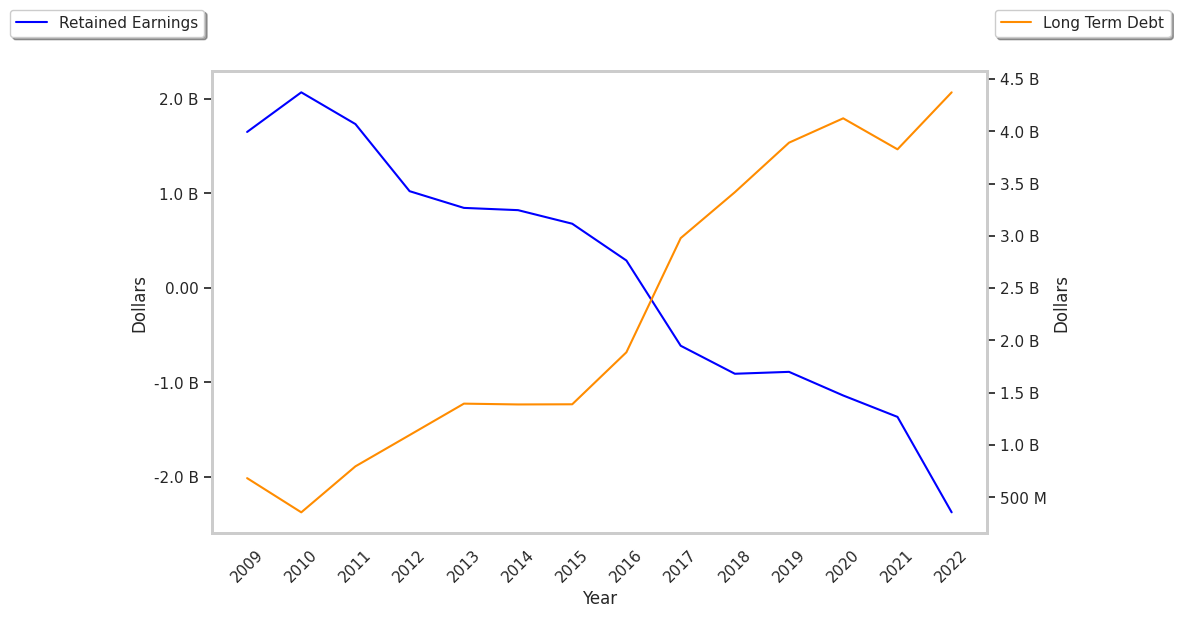
| Total Debt (M) | $3,891 | $4,123 | $4,124 | $4,372 | $5,570 | $5,521 |
| Net Debt / EBITDA | 1.76 | 1.34 | 1.16 | 1.29 | 1.47 | 1.45 |
| Current Ratio | 0.86 | 0.86 | 0.77 | 0.71 | 0.73 | 0.71 |
O'Reilly Automotive benefits from growing revenues and increasing reinvestment in the business, wider gross margins than its peer group, and a strong EPS growth trend. The company's financial statements show generally positive cash flows and healthy leverage levels. However, the firm has not enough current assets to cover current liabilities because its current ratio is 0.71.
O'Reilly Automotive's Valuation Is in Line With Its Sector Averages:
O'Reilly Automotive has a trailing twelve month P/E ratio of 37.2, compared to an average of 20.93 for the Consumer Discretionary sector. Based on its EPS guidance of $44.94, the company has a forward P/E ratio of 2.3. The 14.1% compound average growth rate of O'Reilly Automotive's historical and projected earnings per share yields a PEG ratio of 2.64. This suggests that these shares are overvalued.
There's an Analyst Consensus of Some Upside Potential for O'Reilly Automotive:
The 23 analysts following O'Reilly Automotive have set target prices ranging from $62.0 to $125.0 per share, for an average of $108.13 with a buy rating. The company is trading -5.3% away from its average target price, indicating that there is an analyst consensus of some upside potential.
O'Reilly Automotive has a very low short interest because 1.5% of the company's shares are sold short. Institutions own 89.2% of the company's shares, and the insider ownership rate stands at 0.76%, suggesting a small amount of insider investors. The largest shareholder is Vanguard Group Inc, whose 9% stake in the company is worth $8,074,277,175.