Today we're going to take a closer look at Large-Cap Finance company Brown & Brown, whose shares are currently trading at $94.91. We've been asking ourselves whether the company is under or over valued at today's prices... let's perform a brief value analysis to find out!
Brown & Brown's Valuation Is in Line With Its Sector Averages:
Brown & Brown, Inc. markets and sells insurance products and services in the United States, Canada, Ireland, the United Kingdom, and internationally. The company belongs to the Finance sector, which has an average price to earnings (P/E) ratio of 15.92 and an average price to book (P/B) ratio of 1.78. In contrast, Brown & Brown has a trailing 12 month P/E ratio of 27.4 and a P/B ratio of 2.7.
Brown & Brown has moved -10.8% over the last year compared to 14.4% for the S&P 500 — a difference of -25.2%. Brown & Brown has a 52 week high of $125.68 and a 52 week low of $89.99.
Strong Revenue Growth but an Average Current Ratio:
| 2019 | 2020 | 2021 | 2022 | 2023 | 2024 | |
|---|---|---|---|---|---|---|
| Revenue (M) | $2,392 | $2,613 | $3,051 | $3,573 | $4,257 | $4,805 |
| Interest Income (M) | $64 | $59 | $65 | $141 | $190 | $195 |
| Operating Margins | 22% | 24% | 25% | 25% | 27% | 27% |
| Net Margins | 17% | 18% | 19% | 19% | 20% | 21% |
| Net Income (M) | $399 | $480 | $587 | $672 | $871 | $993 |
| Depreciation & Amort. (M) | $23 | $26 | $33 | $39 | $40 | $44 |
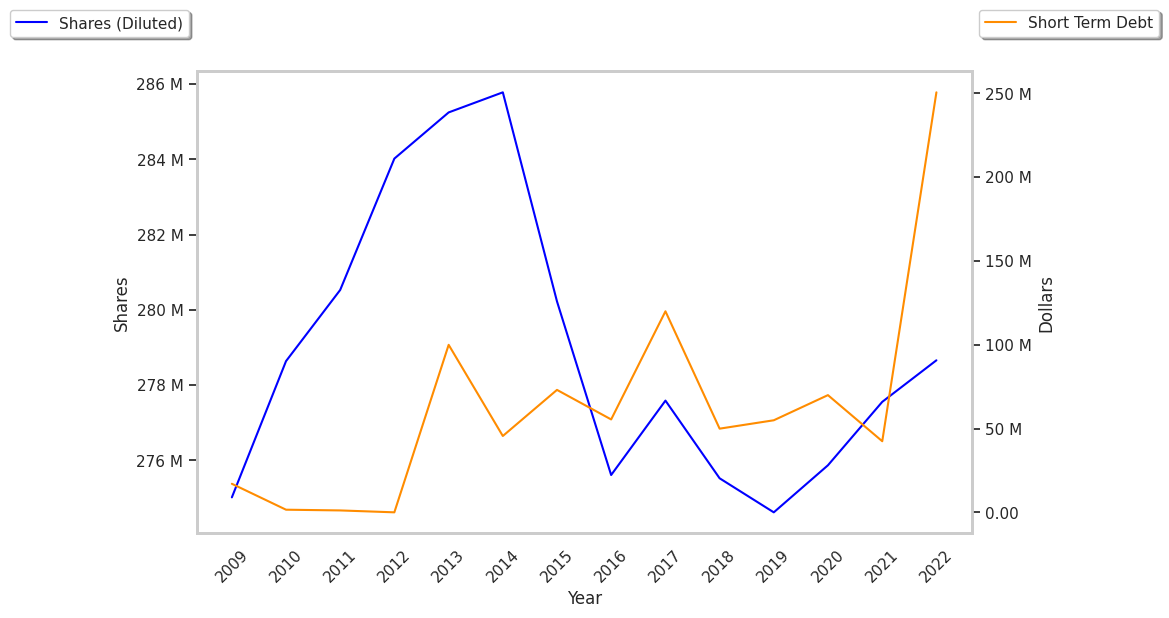
| Diluted Shares (M) | 275 | 276 | 277 | 279 | 281 | 284 |
| Earnings Per Share | $1.45 | $1.74 | $2.12 | $2.41 | $3.1 | $3.5 |
| EPS Growth | n/a | 20.0% | 21.84% | 13.68% | 28.63% | 12.9% |
| Avg. Price | $32.48 | $41.99 | $53.78 | $63.5 | $71.11 | $94.48 |
| P/E Ratio | 22.87 | 24.56 | 25.86 | 26.68 | 23.24 | 27.23 |
| Free Cash Flow (M) | $605 | $642 | $764 | $829 | $941 | $1,092 |
| CAPEX (M) | $73 | $71 | $45 | $52 | $69 | $82 |
| EV / EBITDA | 18.48 | 20.5 | 20.78 | 23.46 | 20.14 | 22.55 |
| Total Debt (M) | $1,610 | $2,166 | $2,065 | $4,193 | $4,365 | $4,049 |
| Net Debt / EBITDA | 1.94 | 2.32 | 1.72 | 3.87 | 3.09 | 2.5 |
| Current Ratio | 1.22 | 1.26 | 1.25 | 1.09 | 1.04 | 1.1 |
Brown & Brown benefits from rapidly growing revenues and a flat capital expenditure trend, strong operating margins with a stable trend, and generally positive cash flows. The company's financial statements show a strong EPS growth trend and reasonable leverage levels. Furthermore, Brown & Brown has just enough current assets to cover current liabilities, as shown by its current ratio of 1.1.