Now trading at a price of $188.99, Marsh & McLennan has moved 1.3% so far today.
Marsh & McLennan returned losses of -17.0% last year, with its stock price reaching a high of $248.0 and a low of $185.12. Over the same period, the stock underperformed the S&P 500 index by -30.0%. AThe company's 50-day average price was $203.18. Marsh & McLennan Companies, Inc., a professional services company, provides advisory services and insurance solutions to clients in the areas of risk, strategy, and people worldwide. Based in New York, NY, the Large-Cap Finance company has 90,000 full time employees. Marsh & McLennan has offered a 1.8% dividend yield over the last 12 months.
Generally Positive Cash Flows but an Average Current Ratio:
| 2019 | 2020 | 2021 | 2022 | 2023 | 2024 | |
|---|---|---|---|---|---|---|
| Revenue (M) | $16,652 | $17,224 | $19,820 | $20,720 | $22,736 | $24,458 |
| Interest Income (M) | $524 | $515 | $444 | $469 | $578 | $591 |
| Operating Margins | 16% | 18% | 22% | 21% | 23% | 24% |
| Net Margins | 10% | 12% | 16% | 15% | 17% | 17% |
| Net Income (M) | $1,742 | $2,016 | $3,143 | $3,050 | $3,756 | $4,060 |
| Depreciation & Amort. (M) | $333 | $390 | $382 | $381 | $370 | $369 |
| Diluted Shares (M) | 511 | 512 | 513 | 505 | 499 | 496 |
| Earnings Per Share | $3.41 | $3.94 | $6.13 | $6.04 | $7.53 | $8.18 |
| EPS Growth | n/a | 15.54% | 55.58% | -1.47% | 24.67% | 8.63% |
| Avg. Price | $91.55 | $104.49 | $138.31 | $156.28 | $189.47 | $186.48 |
| P/E Ratio | 26.61 | 26.25 | 22.31 | 25.58 | 24.93 | 22.58 |
| Free Cash Flow (M) | $1,940 | $3,034 | $3,110 | $2,995 | $3,842 | $3,986 |
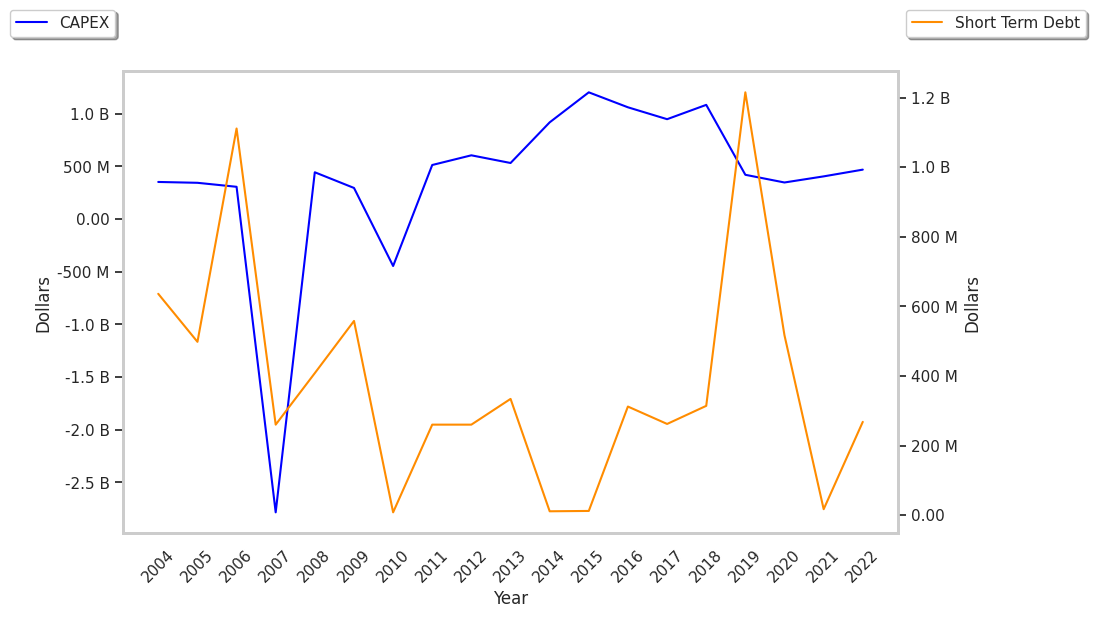
| CAPEX (M) | $421 | $348 | $406 | $470 | $416 | $316 |
| EV / EBITDA | 18.95 | 17.9 | 16.93 | 19.01 | 18.37 | 17.74 |
| Total Debt (M) | $11,956 | $11,313 | $10,950 | $11,495 | $13,463 | $20,466 |
| Net Debt / EBITDA | 3.59 | 2.67 | 1.96 | 2.16 | 1.79 | 2.92 |
| Current Ratio | 1.06 | 1.24 | 1.24 | 1.06 | 1.1 | 1.13 |
Marsh & McLennan has strong operating margins with a positive growth rate and generally positive cash flows. Additionally, the company's financial statements display a strong EPS growth trend and reasonable leverage levels. Furthermore, Marsh & McLennan has growing revenues and decreasing reinvestment in the business and just enough current assets to cover current liabilities, as shown by its current ratio of 1.13.
Marsh & McLennan's P/B and P/E Ratios Are Higher Than Average:
Marsh & McLennan has a trailing twelve month P/E ratio of 24.4, compared to an average of 15.92 for the Finance sector. Based on its EPS guidance of $9.43, the company has a forward P/E ratio of 21.5. Marsh & McLennan's PEG ratio is 2.04 on the basis of the 12.0% weighted average of the company and the broader market's EPS compound average growth rates. This suggests that the company's shares are overvalued. Furthermore, Marsh & McLennan is likely overvalued compared to the book value of its equity, since its P/B ratio of 6.11 is higher than the sector average of 1.78. The company's shares are currently trading 166.7% below their Graham number. Overall, Marsh & McLennan's lofty valuation in terms of earnings and assets is to some extent attenuated by its strong cash flow trend and reasonable levels of debt.
Marsh & McLennan Has an Analyst Consensus of Some Upside Potential:
The 19 analysts following Marsh & McLennan have set target prices ranging from $191.0 to $258.0 per share, for an average of $224.42 with a hold rating. The company is trading -15.8% away from its average target price, indicating that there is an analyst consensus of some upside potential.
Marsh & McLennan has a very low short interest because 1.1% of the company's shares are sold short. Institutions own 92.3% of the company's shares, and the insider ownership rate stands at 0.07%, suggesting a small amount of insider investors. The largest shareholder is Vanguard Group Inc, whose 9% stake in the company is worth $8,723,506,885.